Relationship Between Variables: The relationship between the variables is that the more heat there is the more the sugar will break down and melt into a liquid form, forming more carbon dioxide which will make the dough rise more. The relationship between the amount of sugar and the amount of yeast is that if there’s more sugar and yeast then more yeast cells can break down more sugar. Another relationship is that the more heat up to a limit you put the yeast cells in to grow the more quickly the fermentation process will be. The relationship between the yeast and heat is that the more heat the more yeast cells there will be to break down the sugar.
Fair Test: To make it a fair test you put the same amount of flour and you have to put the same amount of yeast in. You have to do this as if you differ the amount of yeast in the dough that will make your experiment go wrong as with more yeast the dough might rise more. You have to do all your experiments on the same day. The reason this is that the weather affects the growth of the dough so if it’s hotter than another day the yeast cells might die or the growth might be quicker. On the other hand if it’s a colder the yeast cells might grow much slower. Also then the timing of measurement can’t be exact. For the experiment you have to use the same type of beaker or test tube as if the tube is smaller then the dough will be forced to rise up. You have to use the same type of sugar through out. You can’t use brown and white sugar as they might have different boiling point and they would each take a different time to get broken down by the yeast.
Input Variable + Value or Values: My input variable will be the amount of sugar put into the dough and the values will be 10g, 20g and 30g. Each will be done three times.
Output Variable + How it will be Measured: The outcome variable will be the amount that the dough has risen and it will be measured in cm and micro millimetres.
Controlled Variables + Values: My controlled variables are:
1). The amount of flour used has to be the same-50.00g
2). The amount of yeast used has to be the same-10.00g
3). The time the yeast is left to rise- about 4hrs or up to when teacher marked it
4). The same cylinder in which the dough is put into-glass test tube
5). Use the same type of sugar-white
6). Experiment done on the same day- Saturday 8th April
Method: 1). You get all your equipment, which are: 30.00g of yeast, 150.00g of plain flour, water, 50.00g of sugar, 9 test tubes, aluminium foil, scales including digital scales, marker and a ruler.
2). You take a big piece of aluminium foil be careful not to cut yourself and you mix, 50.00g of plain flour, 10.00g of sugar and 10.00g of yeast together with your hands.
3). As you’re mixing the flour add a bit of water. Add enough so the mixture becomes stick. Don’t put too much water that the mixture becomes slushy.
4). As you’re mixing the mixture together constantly keep putting flour on your hand to prevent the dough from sticking onto your hand.
5). Once the dough is a big chunk and golden brown in colour you divide that chunk into three parts to the experiment three times. The reason you do it three times is to double check and in case you went wrong anywhere. Now you’ve got one patch.
6). Now you have to make another patch repeating steps 2-5 only this time you add 20.00g of sugar instead of 10.00g.
7). Then you have to make another patch repeating steps 2-5 this time you have to add 30.00g of sugar. The reason that you keep on adding more sugar by 10.00g is because we’re investigating whether if you add more sugar will the dough rise more.
8). Now that you’ve got 9 chunks of dough you roll all the chunks into thin sausage like rolls that can fit into the test tube, remembering to keep flour on your hands so it doesn’t stick on.
9). When you’ve got nine sausages like rolls you put each one into a glass test tube. At this stage you have to know which is the 10.00g, 20.00g or 30.00g. An easy way to do this by putting all the 10.00g, 20.00g and 30.00g in three different beakers.
10). Once there in a test tube you take a permanent marker and mark on the tube where the tallest point of the dough is.
11). You then leave the dough to rise for about 4hrs or until the teacher marks it.
12). Once the tube is marked you have to measure the height that dough rose by in cm and millimetres. That gives you your results.
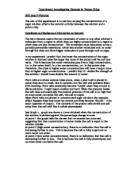
Diagrams:
Mixing the ingredients The
Together patches and pieces
The rolled up dough in The dough rising
The tube and taking the
Measurements
Trials: I had to do my 2nd trial for the 30.00g experiment as the result was similar to a
to 20.00g result and must have gone wrong somewhere. They could have gone wrong as
we might have made an error while measuring the ingredients.
Results:
Discussion: The pattern that I found out was that the more sugar you put in the dough the more the dough rises by. My graph's movement was increasing as you add the amount of sugar. At the second point of 20.00gms the point is not on the line of the best fit as the average is slightly less. The first and third points were on the line. In a way my graph is a semicurve except that it never goes below the line with the exception of the second point where it goes below the line. Reasons that it goes below the line are as follows: We may have made an error in measurements or in weighing the ingredients. The weather could have also effected the height the dough rose by as the dough will tend to rise less in cooler conditions. Another reason could have been that the other two measurements could have been taken at a different time than the 20.00g. Lastly and the most likely explanation is that when we put the rolled up dough into the tube it did not have flour on it so it stuck onto the sides of the test tube. It may have stuck midway that we marked on the tube and later it must have sunk down. All these explanations also occur to what could have happened to the 2nd trial for the 30.00g. My prediction came true. It came true as I said that as you add more sugar the height of the dough will increase and that is exactly what happened that as you add more sugar the height that the dough rises increases. Another very detailed pattern that I saw was that as you add 10.00g to the dough the height that the dough rises increases by about 2cm. From 10.00g, which rose by 5.41cm to 20.00g, which rose by 7.53cm, the increase was 2.12cm, which is about 2cm. From 20.00g to 30.00g, which rose by 9.22, the increase was 1.69 and when rounded up to the nearest whole it’s about 2cm.
Explanation: The reason that the dough rose more and more as kept on adding more sugar is that the yeast cells which are living also breath and during respiration (a breathing process) the yeast cells break down the sugar (also known as glucose) along with oxygen. It gets the oxygen from breathing. When it breaks down these two things a gas called carbon dioxide. This carbon dioxide gets trapped in the dough making the dough rise. So it’s common sense that if you increase the amount of sugar in the dough the yeast cells will have more sugar to break down which means that more carbon dioxide will be formed. As a result of that the dough will rise more. Something known as competition can also affect the height of the dough rises. It can affect the height as all living things compete for resources. The resources that bread dough would compete for would be nutrients, water, space and sunlight. Since yeast cells population keeps doubling and no time at all their population is really large. Since their population increases rapidly the yeast cells would have to compete and fight for the resources, as the resources would be in short supply. As the resources are in short supply yeast cells will die so their population will start to decrease. So depending on how long they are left for and how many survive that could change the height of the dough. If the yeast cells are left for a longer time and the resources finish the yeast cells would die out and so the dough would stay the same level throughout.
Evaluation: My final conclusion is that the more sugar you add the more the bread dough rises, as I have explained earlier in the explanation and discussion. The pattern in my graph was that kept on increasing as you add 10.00g more to the dough. To be absolutely 100% sure about my final conclusion, I should do the 30.00g trial 2 experiment again and do another experiment with 40.00g of sugar in the bread dough. My prediction for the 40.00g experiment is that the dough will rise by about 11-12cm as the dough rises by about 2cm when you add 10.00g of sugar more. I have to be careful that I leave the dough to rise the same time as I left the others to rise in or that can affect the height the dough rises as I have explained in the explanation. My experiments were generally fair as I used the same test tube, same amount of flour and yeast and the same type of sugar. My test wasn’t totally fair as I did the 22nd trial of the 30.00g experiment on a different day as the others where the temperature could have been different and that affects the height as I’ve explained in the explanation. That’s why I have to do a 40.00g experiment and a 30.00g experiment again. If I was to do the experiment again I would try to improve on doing all the experiments on the same day and I would try to leave the all the dough’s for the same time. This time I would definitely try and make sure that the dough doesn’t stick to the SIDES!!