FAIR TESTING:
- I’m going to keep the amount of sugar, the type of sugar and the volume of water the same.
- The one thing I will change is the temperature.
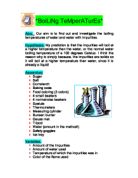
Safety measures:
- Safety goggles
- Safety mat
RANGE: I shall use a range of temperatures from (30℃ - 60℃)
PREDICTION: I predict that when I precede my experience the higher the temperature the quicker the sugar will dissolve. I predict this because I know from my science lessons. Some solids dissolve in water and evaporation can occur in this experiment knowing from my own scientific knowledge.
VARIATION: In this experiment I could vary the types of sugar and the amount of sugar. I could also change the volume of water. I could also change the temperature. I could change different types of liquids.
TABLE OF RESULTS:
TIME TO DISSOLVE
TO FIND OUT THE AVERAGE I ADD UP (1ST,2NDAND 3RD) AND DIVIDE BY 3
(LAYOUT OF THE EXPERIMENT)
CONCLUSION: I have found out the higher the temperature the quicker it takes for the sugar to dissolve. I know from my I own knowledge that certain solids dissolve at certain temperatures. After drawing the graph, I found out I had to be more accurate with the experiment, but I’m still happy how my plots on the graph came out. You couldn’t do the experiment perfect because the room temperatures one of the things that might effect the experiment.
EVALUATION: I started my investigation by planning and practising the experiment so I would get good and clear results. This experiment was very straight forward and simple to proceed. The very first thing was my planning this consists of writing a step by step plan on what to do for the experiment. Secondly I wrote out my Equipment list this is what I had to use in the experiment. Thirdly I wrote out my fair testing this is just simply what I changed and what I kept the same in the experiment. Fourthly I wrote my safety measures this is just what equipment I used to be safe. Fifthly I wrote my range this is just what variety of temperatures I was going to use for the experiment.
Sixthly I wrote out my prediction this is what I was guessing what will happen. Seventhly I wrote my variation this is just what other things I could change in the experiment. Eighthly I done my table of results in this I showed what I did in each experiment but on a graph and I drew out my layout of the experiment. Last of all I done my conclusion in this I wrote about the pattern of the graph and explaining the pattern using my science knowledge and evaluation this I have to talk about the plots on the graph, how could I improve the experiment and a summary of the whole investigation.
I WAS JUST ABOUT HAPPY WITH MY GRAPH ON HOW IT LOOKED AND HOW THE POINTS CAME OUT. I COULD HAVE IMPROVED IT BY MAKING SURE IT WAS ACCURATE ENOUGH. BUT I TRULY TRIED MY BEST METHOD IN THIS GRAPH. I CAN IMPROVE MY METHOD BY PRACTISING AND LEARNING THROUGH INVESTIGATION.
THE END
THANK YOU FOR READING!