Fair test
To create a fair test certain I can only change one key variable that is the concentration of the solutions whilst the rest remain the same.
My Key Variable will be the concentration of sucrose solutions I will use: 0.2Molar, 0.4Molar, 0.6Molar, 0.8Molar, 1.0Molar, I have chosen these because in my pilot
Variable to keep the same:
- Volume of solution
- Amount of time in solution
- Measuring utilities
- Cut potato chips into same size.
The mass of the potato is a needed variable. This means that I will weight many times through out the experiment. I will measure the weight in grams. I will weigh the potato chip before and after it is put in the solution. This will allow me to determine whether osmosis has taken place. The volume of the solution that the potato chips are placed in must be the same at all times. The potato chip must be covered completely in the sucrose solution, and the amount of solution will be kept the same. I will us the same scale to weigh the potato chips as the measurement may vary slightly between different sets of scales.
Apparatus
- 5 Foam Cups
- Ruler
- Scalpel
- Small cutting board
- Labelling pen/pencil
- Sucrose solution
-
Measuring cylinder (100cm3)
- Timer
- Filter paper
- 10 potato chips
Method
Label each of the cups 0.2Molar, 0.4Molar, 0.6Molar, 0.8Molar, 1.0Molar.Using the measuring cylinder, carefully measure out 20cm3, for each cup. Using the ruler, cutting board and scalpel, measure out 10 pieces of potato, each 1cm thick and 3.5 in length and cut to size with the scalpel. Now Weigh each piece of potato and write down the weights in the results table. Place two pieces of potato into each cup. Start the timer and leave the potatoes for 15 minutes. After 15 minutes take out each potato chip and put them onto a piece of filter paper to dry. Once they have dried, weigh each of them, making sure you note which concentration each was in. Enter in your results in to the table. Find the weight for each concentration and then find the percentage increase/decrease for each and find the average for this too. And then repeat the experiment.
Results
Graph 1 – The average weight before and after Osmosis.
The graph above shows the line of best fit for the average weights of potato chips before and after Osmosis in different concentrations of sucrose solution. It clearly shows that in low concentrations of sucrose solution, the potato chips gained mass/weight water and in higher concentrations of sucrose solution, the potato chips lost mass/weight.
Graph 2- Average Weight Change
Graph 3- Average % weight change
Analysis
My Predictions was correct because at 0.5 molars there was no change in weight.
From these experiments, I have found out that my predictions were correct. In lower concentrations of sucrose, Osmosis takes place and the potato chips become fat or thick. In higher concentrations of sucrose, Osmosis takes place but the potato chips become petit.
I have found that: As the concentration of solution gets higher, the average weight of the potato’s living tissue after Osmosis decreases.
Graph1 shows that the average weight after Osmosis and the concentration of sucrose solution are not directly proportional. There is, however, a pattern in my graph, showing that the average weight after Osmosis and the concentration of sucrose are inversely proportional. As the concentration of sucrose rises, the average weight after Osmosis decreases. This graph shows that my first predictions were correct. It shows that the potato cells increase in mass/weight in solutions with a high water concentration and decrease in mass/weight in solutions with a lower water concentration
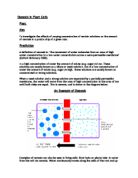
In conclusion although the water molecules pass both ways through the membrane in two way traffic, but because there are more on one side than the other there’s a steady net flow into the region with fewer water molecules i.e. into the stronger solution. Osmosis makes plant cells swell up if they are surrounded by weak solution of water and they become turgid, and the plant cells surrounded by the stronger solutions of water shrinks because water leaves their cell, to even thinks out.
Evaluation
In my opinion the experiment was very successful. I obtained a large quantity of results. From these results, I was able to draw up a useful graph. I think I manage to get enough results for the each concentration I was using. I also think that I gave the experiment ample time for Osmosis to occur.
The process I found most difficult in this experiment, was cutting the potatoes accurately. It was very difficult to accurately cut the potatoes to the same length, due to human error. To get more accurate results I could have used a scale that went in to more decimal points.
In my opinion, there were not many anomalies, only two in fact. Slight differences may have been the result of when I handle them after drying each potato, some more than others. This could have meant that some potato chips would have had more excess water than others, which resulted in an increased mass. However, I was please with my experiment and I though it was successful and I am very pleased with my results.
Maybe if I were to repeat the investigation again I would probably try use a wider range of concentrations by going into two decimal places i.e. 2.5M, help to find a wider range and more varied results. Also I would try using a different plant tissue like vegetables.
The Change OF Weight in Living Tissue in varying concentration of solutions.
Page of