The pieces of apparatus that I will use are:
-
10 cm3 measuring cylinder – used to accurately measure the sugar solutions
- test tube
- potatoes – the same brand to ensure reliability
- potato chipper – used to get chips of a uniform surface area
- Electronic balance – correct to 2 d.p.
-
pipette – used to accurately measure out 10cm3 of sugar solution
- Different sugar solutions.
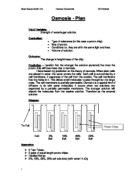
I will set up the experiment as follows:
To ensure that this is a fair test, I need to make sure that there is only one variable – the concentration. So I need to make sure that the chips all have the surface area, that the temperature is the same and that the volume of each concentration is the same.
I am going to use six different concentrations because that is the amount that I feel you need to obtain a graph that is an accurate representation of the experiment. The concentrations are 0.25M, 0.3M, 0.35M, 0.4M, 0.45M AND 0.5M. I know to use these concentrations because when I did my preliminary work. In my Pilot study, I used the concentrations 1M, 0.5M, 0.2M and 0M, the trend was the higher the concentration, the lighter the potato. The line of the graph (next page) passed through the X-axis somewhere between these concentrations, this means that the potato will keep it’s mass somewhere between these concentrations. To ensure reliability and check for anomalous results, I will do 2 repeat tests.
After the repeat tests, I will find out the percentage difference in the potatoes in each test and then average the answer out. I will use percentage difference as the potatoes all have slightly different starting weights. If you use different in mass then you are unsure about how much is lost, if a potato is 50g and loses 1g then it isn’t that much difference but if a potato is 2g then a 1g loss is a big difference. Using % difference avoids this confusion. The formula for % difference is.
- (100 – ((final weight divided by start weight) X 100))
I will record the data in a table, the data will be correct to 2 d.p because that is the accuracy of the concentrations. The table will look this,
If my results are correct then my graph should look something like this,
These are the results that I got from the investigation.
The results of chip 2 in the 0.25M solution and chip 3 in the 0.3M solution were both anomalous. That is why there is it is shaded in the table. Here are the anomalous results.
The first anomalous result loses weight when the other results for that concentration gain weight and the second anomalous result gains weight when the other results for that concentration lose weight.
On my graph, the Y-axis is going to be % change and the X-axis is going to be concentration so this is what I will be plotting.
Analysis
Looking at my graph, I can see that no net change in weight occurred and therefore the concentration of the sugar solution in potato cell sap is 2.7M. I found this by looking at where my line crosses the X-axis.
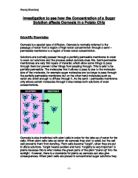
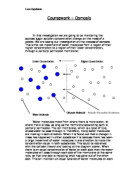
Osmosis is the movement of water molecules through a partially permeable membrane due to a concentration gradient. Water moves from one area with a low concentration to an area with a high concentration. If you place a plant in water, then water will move into the plant cells by osmosis;
- The cell membrane of the plant cell acts as a partially permeable membrane.
- The cell sap inside the vacuole has a high concentration.
- Water passes into the cell by osmosis.
- The concentration of the sap in the vacuole is now weaker.
- Water passes from the weak solution into the strong solution in the next cell by osmosis.
When potatoes are placed into a sugar solution. Osmosis takes place, if a potato is placed into a more concentrated sugar solution, water will move out of the potato and into the sugar solution, this why the potato will get lighter - there is less water in the potato. If a potato is placed into a less concentrated sugar solution, water will move into the potato and therefore make it heavier.
If the potato chip hasn’t changed mass then the solution in the test tube is the concentration inside the potato because for osmosis not occur when there is water, there has to either be no partially permeable membrane or no concentration gradient. From previous tests, I know that there is a partially permeable membrane so there must be no concentration gradient so the concentrations are the same.
I looked at where the line crosses the X axis because that is where the potato didn’t gain or lose any weight, therefore Osmosis didn’t take place and therefore there isn’t a concentration gradient and therefore the concentration outside the potato is the same as inside the potato.
Evaluation
Overall, the experiment was a success, I good a satisfactory graph, looking at my table, all my results were relatively close together, I got no major anomalous results and I found out what I wanted to find out.
This experiment was by no means perfect though; there were a couple of problems.
The measurements of the sugar concentrations were quite inaccurate because I had to make the concentrations myself. I used a 1M sugar solution and water to dilute the sugar into the desired concentrations, The problem is that the pipette that I used to measure the solutions has an inaccuracy so the concentrations aren’t exact. If I used exact, pre-made concentrations instead of making my own then it would have been more accurate.
To weigh my chips, I used an electronic scale correct to 2 d.p. but the last decimal place rarely settled and the number continuously changed. I decided to keep it to two decimal places because if the reading I got was 2.23 2.24 2.25 then any one of those readings is more accurate than 2.2 or 2.3.
I have already mentioned my two anomalous results, the first anomalous result loses weight when the other results for that concentration gain weight and the second anomalous result gains weight when the other results for that concentration lose weight.
This could have happened in a number of different ways, the chips could have more/less surface area so the rate of osmosis is changed, the chips could have been placed in the wrong solution or I could have weighed them incorrectly.
Looking at my results, I see that only one of my results gained weight so it might have been better to change the 0.45M and the 0.5M solutions to 0.15M and 0.2M solutions.
To improve my results, I should pool them with others to get averages and more accurate results. To extend my investigation, I could look at Osmosis in different plant cells such as carrot or cauliflower cells and I could look in animal cells as well.