Water.
2 measuring cylinders.
A conical flask.
Hydrochloric acid.
A stopwatch.
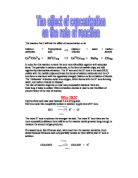
We shall mark a sheet of paper with a cross. The sheet of paper shall then be placed on the desk. We shall then pour 50 cubic cm of sodium thiosulphate into a conical flask. I shall then pour it into a dry 100 cubic cm conical flask and place it over the previously drawn cross. Then 5 cubic cm of HCl shall be poured into a measuring cylinder. Add the HCl to the beaker and immediately start the stopwatch. Look at the cross and note the time in seconds it takes for the cross to disappear. I will note this time in a table similar to the one below.
I shall then empty out the contents of the conical flask and wash it. I will then repeat the procedure with 40 cubic cm of sodium thiosulphate. 10 cubic cm of water shall then be added to make the solution up to 50 cubic cm. Finally the 5 cubic cm of HCl shall be added and the stopwatch started.
The experiment shall be repeated twice for each reading. It is important to keep follow this plan carefully in order to maintain reliable and precise results.
* The rate of reaction is found by putting 1 over the average time. To make plotting any graph easier I have multiplied this value by 1000.
Analysis
The higher the concentration of sodium thiosulphate in the solution, the faster the rate of reaction was. This is because there were more sodium thiosulphate atoms to collide with the water atoms. This means that the reaction took place faster.
The graph which shows sodium thiosulphate against time is a downward sloping curve. This shows that the two variables are not directly proportional. It also shows that the less sodium thiosulphate there was the longer the reaction took.
There appears to be just two small anomalies at 20cm3 and 25 cm3. These do still, however follow the trend and should not cause me to doubt the accuracies of my experiment.
The graph to show the rate of reaction against the amount of sodium thiosulphate is a straight line going through the origin. This shows that the two variables are directly proportional. This is because if there is twice as much sodium thiosulphate their will be twice as many atoms. This means that the chance of a collision between the sodium thiosulphate atoms and the water atoms double. This means that the reaction will go twice as quickly. This explains why there is a direct relationship between the two.
My original prediction was that when the concentration of sodium thiosulphate is high then the cross will disappear more quickly. If the concentration of sodium thiosulphate is low then the cross will take longer to disappear.
My results support my prediction, as the rate of reaction was faster when there was more sodium thiosulphate. This means that my results did indeed turn out as I expected them to.
There were however a few anomalous results. The graph to show sodium thiosulphate against the rate of reaction shows that with 30cm3 there is an anomaly. This can be put down to slight inaccuracies in the experiment (see conclusion).
My results did indeed turn out how I expected them to as they closely match what I wrote in my prediction. I am satisfied with the results that I have found.
Conclusion
The experiment did give results that were reliable. We conducted the experiment with care, and followed the method well. The line of best fit proved that there was a strong correlation between the results that I found.
There were some small anomalies which could have arisen from small inaccuracies with the measuring. These are not enough to disprove any conclusions we can draw from the graph. When I used 50 cm3 of sodium thiosulphate I found that the two readings I obtained were exactly the same at 26 seconds. However when I used 30cm3 of sodium thiosulphate and 20cm3 of water I found two contrasting results. I found the first time that I did it, it took 49 seconds and that the second time I did it, it took 61 seconds. These two results were quite far apart. As this was one of the longer tests I can conclude that the irregularity arose from the deciding of exactly when the cross had disappeared. However, for the longest experiment there was only a five second gap. I can only assume here that there was a human error in the measuring of one of the three liquids.
In my method I decided how many readings I would take. I thought that taking 6 readings would be enough to be able to draw a graph and have enough information to make conclusions. I did enough to answer the question ‘how does the concentration of sodium thiosulphate affect the rate of reaction?’.
My experiment did have small anomalies showing that there were slight deficiencies in accuracy. There were no results that were so anomalous that I needed to redo the test for that reading. My results always showed a clear trend and so I feel that my results were accurate. I could have improved the accuracy however by using a light sensitive detector. I would place this underneath a tripod and place the beaker on the tripod. I would have carried out the experiment as above. The light sensitive detector would have enabled me to know exactly when the light could no longer penetrate the solution. This would have given me more accurate results.
Another way of extending the experiment and thereby improving the accuracy of the experiment would be to take more readings. This would ensure greater accuracy. It would especially help when drawing the line of best fit, as there would be more points upon which to base it on. Ideally every single variant concentration of water and sodium thiosulphate would be used between 0 and 50.
I could also carry out another experiment to see how the concentration affects the rate of reaction. I could place some magnesium ribbon in pure hydrochloric acid. I could then put the magnesium in varying concentrations of HCl by diluting it with water. I could then time how long it took the magnesium ribbon to disappear. I would do each experiment twice to improve accuracy. I would expect to find that the higher the concentration of hydrochloric acid the faster the magnesium ribbon would disappear.