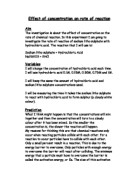
How does concentration affect the rate of reaction?
When the concentration of the acid is increased then the reaction would proceed faster because there are more H+ ions in solutions to collide. In a more dilute acid there isn’t as many H+ ions so the chance of a collision is decreased.
The more successful collisions the faster the rate of reaction.
Variables
The Independent variable is Concentration where different concentrations of hydrochloric acid are to be used. The dilutions are shown on the following page.
The Dependent variable is the time taken to collect 100cm3 of Carbon dioxide.
The Control variables are
-
Overall volume of acid solution should be kept at 50cm3.
- The mass of the marble chips should be kept at 2g.
- The same approximate size of marble chips must be used.
- The same original batch of 1M HCl should be used co that the concentration isn’t changed.
- The same size of cronical flask (100ml) should be used.
- Same stopwatch should be used.
- The temperature should be kept constant at room temperature using a water bath.
- The same gas syringe should be used.
Independent Variable
The solutions are made by taking a certain volume of 1M HCl and a certain volume of distilled water and mixing them together (serial dilution).
The serial concentrations are shown in the table below:
Predictions
There is an electrostatic attraction holding the calcium carbonate together.
The diagram below shows the CaCO3 in a beaker of HCl.
In the HCl there are H+ ions and Cl- ions and they are colliding with the CaCO3. If the collisions are made with sufficient force then they will break the electrostatic force between the CaCO3 ions. This is called the collision theory.
The CaCO3 is broken into Ca2+ ions and CO32- ions. The Ca2+ ions react with the Cl-ions and form CaCl2 (calcium chloride). The CO2- ions separate into O2 ions and carbon dioxide (CO2) is given off. The O2 ions react with the h+ ions and form water (H2O).
The concentration of the acid is doubled the amount of ions is doubled and so there is a greater chance of collision so the reaction will happen twice as quick. So this means that the relationship between rate of reaction and concentration.
But the rate of reaction is inversely proportional to the time taken to collect 100cm3 of CO2, which means that rate of reaction will be measured as 1/time.
Method
The equipment used was based on accuracy. A list of the equipment and chemicals are shown below:
Equipment
-
Burettes x2 - accurate to 0.1cm3
-
Gas syringe - accurate to 1cm3
- Electronic balance - accurate to 0.01g
- Stopwatch - accurate to 1 second
-
Cronical flask - 100cm3
- Filter funnel
- Filter paper
- Large beaker
Chemicals
- Small marble chips
- Distilled water
- 1 molar Hydrochloric acid
Below is the actual method used when doing the experiment:
- Fill up one of the burettes with water (using the filter funnel and the filter paper) and the other with HCl.
-
Measure out 50cm3 of HCl into a cronical flask using the burette.
- Then weigh out 2g of small marble chips
- Ensure that the gas syringe is working smoothly
- Then add the marble chips and quickly replace bung
- Start stopwatch
-
Then record how long it takes to collect 100 cm3
- Repeat for all the solutions
- And then repeat the whole experiment again because working with two sets of results will be more accurate.
The below table is calculating concentration from serial dilutions. Using the formula:
Concentration = Vol of HCl x molarity (1 molar)
Initial Vol of HCl
The results will be put in the table shown below:
Then with the results graphs will be plotted, the graphs below is what they should look like:
The experiment was done twice and the results are shown in the table below:
The results show clearly that as the concentration increases the rate of reaction increases.
With the results the graphs shown in the ‘strategy for dealing with results’ are drawn.
These are shown on the next two pages.
The first graph that will be discussed is the concentration against time taken to collect 100cm3 of CO2 graph.
When the concentration is 0.2 mol/dm3 the time is 830.5secs then when the concentration is 0.6 mol/dm3 the time is 252.5secs this proves that as the concentration is increased the time is decreased.
The line goes down with a steep gradient then it starts to tail off when the concentration gets higher. There is a steep gradient at the lower concentrations because as the number of ions increase then there is a greater chance of successful collisions.
As only the surface ions can react, then only so many H+ ions and Cl- ions can collide with the surface CaCO3 ions at anyone time so at higher concentrations there is a less pronounced effect.
Rate of reaction is inversely proportional to time. The faster the rate of reaction, the less time taken to collect 100cm3 of CO2 so rate of reaction can be calculated as 1/time. When the graph Rate of reaction against concentration was plotted the relationship was proportional, so a straight line though the origin was obtained.
As the point circled is a bit out from the line this suggests there were minor errors in the experiment but since the point is very close to the line, the relationship is proportional.
The graph shows that if the concentration is doubled then the rate of reaction is doubled.
To check if it is a good line of best fit, this was made:
As the concentration is doubled from 0.2 mol/dm3 to 0.4 mol/dm3 the actual results are very nearly doubled, as 1.2secs-1 doubled is 2.4secs-1, and 3.39secs-1 is very close to 2.4secs-1.
Also the line is very good as the actual results and the results from the line are very close.
When the concentration is doubled to 0.8 mol/dm3 from 0.4 mol/dm3, the results from the line are better than the actual results because if 2.39 is doubled it is 4.78, this is quite far from 5.92, but when the results are taken from the line they are more proportional.
The proportional relationship can be explained by the fact that as concentration is doubled the number of H+ ions and Cl- ions are doubled so the Rate of reaction is also doubles because as the ions are made twice as likely to collide, the reaction happens twice as quickly so it takes half the time. Readings were taken to prove that this is the case. As 0.2 mol/dm3 is doubled to 0.4 mol/dm3, the rate of reaction approx. doubles from 1.2secs-1 to 2.39secs-1. Also the time taken to collect 100cm3 of Co2 at
0.2 mol/dm3 is 830.5secs-1 and it is roughly halved so that the time at 0.4 mol/dm3 is 419secs-1.
Chemical reactions can only occur if collisions are made with sufficient force and correct orientation. This is called the collision theory. Rate of reaction is how frequently effective collisions occur.
Ions must be correct orientated and collide with a certain amount of activation energy so that the old bonds can be broken.
The H+ ions and Cl- ions are strongly attracted to the CaCO3 ions. The H+ ions are attracted to the CaCO32- ions because they are oppositely charged and the Ca2+ ions and Cl- ions are attracted for the same reason.
The Ca2+ ions react with the Cl- ions to form CaCl2.
The CO3 breaks up into CO2 and O. The CO2 is given off as a gas and the O ions join with the H+ ions and form water (H2O).
Energy is released when the new bonds are formed so this means that this is an exothermic reaction.
When the concentration is increased there are more ions in solution. Since there are more ions in the same volume of space then they are more crowded so therefore more effective collisions will result and the rate of reaction will increase. When the rate of reaction is tripled, 100cm3 of CO2 will be collect in a third of the time.
The following are readings that prove this:
-
0.2 mol/dm3 is tripled to 0.6 mol/dm3.
-
1.2 is the rate of reaction when the concentration is 0.2 mol/dm3 and it is approximately tripled to 3.96 when the concentration is 0.6 mol/dm3.
-
At 0.2 mol/dm3 the time taken (830.5 secs) is divided by approximately 3 to get the time taken when the concentration is 0.6 mol/dm3 (252.5 secs).
In the graph of concentration against rate of reaction there is a point that is circled, this is an anomalous result. This is not very close to the line of best fit and it suggests that there were minor errors during this part of the experiment.
The possible things that could have gone wrong in this experiment are listed below:
- The bung might not have been on tight enough,
- The gas syringe might have been sticky and damp,
-
The bung might not have been on quick enough, and because the reaction is fast of the beginning, some CO2 may have been lost,
- The size off the marble chips varied because it was very hard to get ones all the one size,
- It was hard to put the bung on and quickly start the stopwatch.
All the other points on the graph are good and this suggests the experiment was done very accurately:
-
Burettes were accurate to 0.1cm3,
- Stopwatch was accurate to 1sec,
-
Gas syringe was accurate to 1cm3,
- Electronic balance was accurate to 0.01g.
The following things could be done to improve the experiment and make the results more accurate:
- If the experiment were done more times then the averages would be more accurate,
- If a wider range of concentrations were used,
The instruments used in this experiment were very precise.
The main problem is trying to get the bung on very quickly without any CO2 being lost. To make this better a side arm cronical flask could be used. The following is a diagram of how this could be used: