TIME(mins) HEIGHT OF FROTHcm VOLUMEOF OXYGEN(cm³) HEIGHT OF FROTHcm VOLUMEOF OXYGEN(cm³) HEIGHT OF FROTHcm VOLUMEOF OXYGEN(cm³)
0.5 0.1 0.5 0.1 1 0.1 1
1 0.1 0.5 0.1 1 0.1 1
1.5 0.1 0.5 0.1 1 0.1 1
2 0.1 0.5 0.1 1 0.1 1
2.5 0.1 0.5 0.1 1 0.1 1
3 0.1 0.5 0.1 1 0.1 1
3.5 0.1 0.5 0.1 1 0.1 1
4 0.1 0.5 0.1 1 0.1 1
4.5 0.1 0.5 0.1 1 0.1 1
5 0.1 0.5 0.1 1 0.1 1
AVERAGES
Table of averages from each of the above temperatures
TEMPERATURE: 10ºC
TIME(mins) HEIGHT OF FROTHcm VOLUMEOF OXYGEN(cm³)
0.5 2.5 5.0
1 3.2 8.0
1.5 3.9 10.3
2 4.6 11.3
2.5 5.1 12.0
3 5.3 12.7
3.5 6.0 12.7
4 6.4 13.3
4.5 6.6 13.3
5 6.9 13.3
TEMPERATURE: 25ºC
TIME(mins) HEIGHT OF FROTHcm VOLUMEOF OXYGEN(cm³)
0.5 3.3 7.3
1 5.3 12.0
1.5 6.1 15.7
2 7.4 19.0
2.5 8.4 20.0
3 9.4 20.6
3.5 9.7 21.0
4 9.7 21.0
4.5 9.7 21.0
5 9.7 21.0
TEMPERATURE: 37ºC
TIME(mins) HEIGHT OF FROTHcm VOLUMEOF OXYGEN(cm³)
0.5 4.5 9.7
1 6.5 16.6
1.5 8.5 22.3
2 10 25.3
2.5 10 28.7
3 10 28.7
3.5 10 28.7
4 10 28.7
4.5 10 28.7
5 10 28.7
TEMPERATURE: 55ºC
TIME (mins) HEIGHT OF FROTHcm VOLUMEOF OXYGEN(cm³)
0.5 5.0 13.7
1 6.3 19.0
1.5 7.1 22.0
2 8.0 24.0
2.5 8.0 25.0
3 8.0 25.7
3.5 8.0 26.0
4 8.0 26.0
4.5 8.0 26.0
5 8.0 26.0
TEMPERATURE: 100ºC
TIME (mins) HEIGHT OF FROTHcm VOLUMEOF OXYGEN(cm³)
0.5 0.1 0.83
1 0.1 0.83
1.5 0.1 0.83
2 0.1 0.83
2.5 0.1 0.83
3 0.1 0.83
3.5 0.1 0.83
4 0.1 0.83
4.5 0.1 0.83
5 0.1 0.83
These two tables show the average measurement that we recorded for each temperature.
HEIGHT
Time (mins)
Temperature (ºC) 0 0.5 1 1.5 2 2.5 3 3.5 4 4.5 5
10ºC 0 2.5 3.2 3.9 4.6 5.0 5.3 6.0 6.4 6.6 6.9
25ºC 0 3.3 5.3 6.1 7.4 8.4 9.4 9.4 9.4 9.4 9.4
37ºC 0 4.5 6.5 8.5 10 10 10 10 10 10 10
55ºC 0 5.0 6.3 7.1 8 8 8 8 8 8 8
100ºC 0 0.1 0.1 0.1 0.1 0.1 0.1 0.1 0.1 0.1 0.1
VOLUME
Time (mins)
Temperature (ºC) 0 0.5 1 1.5 2 2.5 3 3.5 4 4.5 5
10ºC 0 5.3 8 10.3 11.3 12 12.7 12.7 13.3 13.3 13.3
25ºC 0 7.3 12 26.7 19 20 20.6 21 21 21 21
37ºC 0 9.7 16.6 22.3 25.3 26.7 26.7 26.7 26.7 26.7 26.7
55ºC 0 13.7 19 22 24 25 26.7 26 26 26 26
100ºC 0 0.8 0.8 0.8 0.8 0.8 0.8 0.8 0.8 0.8 0.8
Analysing results and Conclusion
From my results it appears that catalase works best at 37ºC, and it is virtually denatured at boiling point.
Looking at the initial part of the reaction (see graph 1) it is clear that the gradient at the beginning gets steeper when looking at the temperatures between 10ºC-55ºC. At each temperature the line levels off towards the end of five minutes. Looking at graph 2, there is a steady rise in height of froth up to 37ºC and then a gradual fall up to 100ºC.
Looking at my background knowledge and prior experiments using enzymes I can explain my results as follows.
Kinetic theory states that particles, which gain heat energy, move more quickly. In our case the reacting particles are the substrate (hydrogen peroxide) and the enzyme catalase. As the temperature is increased the particles of hydrogen peroxide have more energy therefore they collide with the potato more frequently and so increasing the rate at which the product is formed. However at a certain temperature this is no longer the case. This is because enzymes are proteins and proteins can be denatured at high temperatures. This is because proteins have a 3D shape. In our case the catalase has a certain shape that the substrate fits into. At high temperatures the active site on the enzyme is altered, see diagram below.
(Diagram showing active site on the enzyme is altered therefore stopping products being formed)
This stops the substrate from 'fitting´ and so no product is formed.
My results do not totally support or undermine my original prediction. The reason being that on graph 1, my results suit my prediction. It shows that the temperature, 37ºC was the fastest and 100ºC is when the enzyme denatures. But in graph 2, my results undermine my original prediction as at 55ºC the reaction still takes place where as in my prediction I stated that enzymes would denature at 40ºC approximately, I didn´t expect this is happen.
Evaluation
In my investigation I was pleased with my achievements.
In my method, keeping the temperature constant throughout the investigation was hard to maintain, as the temperature of the contents of the tube would change quite quickly and therefore the hydrogen peroxide wouldn´t be at the temperature required. To overcome this problem I could keep the test tubes in a hot water bath for all the temperatures making sure that the water bath was the suitable depth. This would ensure constant temperature throughout the whole 5 mins. Also another problem that I encountered was to keep the height of the froth fair. I measured the height of the froth with a 30cm ruler against the test tube rack, with the support of my hand. As I was measuring, my hand would move from time to time and therefore didn´t know where I should place my ruler afterwards. To over come this I should attach the ruler onto the test tube rack with cello tape, as it is transparent or maybe use a pointer.
With respect to I measured the height of froth in cm, but to be more precise I should have measured it in mm. To over come this I should use a ruler with mm readings. Also another problem that I observed on accuracy was that I didn´t allow the temperature to equilibrate to the right temperature. In this case I wasn´t using the correct temperature that I wanted, this could have led to some anomalous results. Ideally I should have brought the temperature of the hydrogen peroxide up to the needed temperature before adding to the potato.
Looking back at my results I found some anomalous results in my findings. When averaging I used these results, which could of made the average either lower or higher than it should be. To improve this I should have missed these results. Not including some sets of results when making averages may have led to better values.
My results are in line with those I predicted. Graphs indicate rise in temperature up a point leads to an increase in oxygen production. This is in line with kinetic theory. However it is very clear that after a certain temperature is reached the enzyme actually virtually stops. This supports my theory of lock and key fit.
However optimum activity of enzyme is at about 37ºC this is as we expected. But at 55ºC the enzyme is still not denatured according to my results. This is a higher temperature than I would expect. Possible not allowing solutions to reach temperatures selected has led to an inaccuracy. It may be that in fact that many temperatures of solutions were lower than we stated.
Overall, due to reliable repeats and in general predictions being confirmed I feel my results are reliable enough to make a conclusion.
The obvious thing I would improve about the measurements I made would be to increase the range of temperatures used. Especially between 55ºC-100ºC. In this way it may be clearer at the temperature which denaturing took place, and would possibly give a graph that resembled the graph in background knowledge.
Another way of improving this investigation is to change the method. I measure the volume of oxygen that was produced. In order to get pure oxygen without any other gases that are in the air I would use the same equipment but make sure that the gap between the rubber bung and solution was free from any other gases.
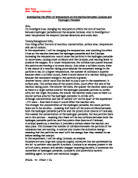
The Effect Or Varying Enzyme Concentration On The Breakdown Of Hydrogen Peroxide In The Presence of
Hypothesis - Hydrogen peroxide will breakdown to oxygen and water in the presence of Catalase. The reaction will increase with increasing enzyme concentration when molecules of hydrogen peroxide are freely available. However, when molecules of the substrate are in short supply, the increase in rate of reaction is limited and will have little effect.
Variables - In this investigation, the variables that affect the activity of the enzyme, Catalase, were considered and controlled so that they would not disrupt the success of the experiment.
i) Temperature - As temperature increases, molecules move faster (kinetic theory). In an enzyme catalysed reaction, such as the decomposition of hydrogen peroxide, this increases the rate at which the enzyme and substrate molecules meet and therefore the rate at which the products are formed. As the temperature continues to rise, however, the hydrogen and ionic bonds, which hold the enzyme molecules in shape, are broken. If the molecular structure is disrupted, the enzyme ceases to function as the active site no longer accommodates the substrate. The enzyme is denatured.
To control this variable, the temperature was maintained at a fairly constant level that allowed the enzyme to work effectively (room temperature, approximately 23°C). This was achieved by using a test tube rack and tongs to handle the apparatus so that the heat from my hands did not affect the Catalase.
ii) pH - Any change in pH affects the ionic and hydrogen bonding in an enzyme and so alters it shape. Each enzyme has an optimum pH at which its active site best fits the substrate. Variation either side of pH results in denaturation of the enzyme and a slower rate of reaction.
In this experiment, the pH was kept constant using a pH 7 buffer, selected to maintain a pH level suited to the enzyme by being equal to the natural environment of the enzyme (potato tissue).
iii) Substrate Concentration - When there is an excess of enzyme molecules, an increase in the substrate concentration, produces a corresponding increase in the rate of reaction. If there are sufficient substrate molecules to occupy all of the enzymes' active sites, the rate of reaction is unaffected by further increases in substrate concentration as the enzymes are unable to break down the greater quantity of substrate.
To control the substrate concentration, identical quantities of the substrate were used for each reading. To ensure that this was measured precisely, 5ml syringes were used to accurately gauge to exact quantities.
iv) Inhibition - Inhibitors compete with the substrate for the active sites of the enzyme (competitive inhibitors) or attach themselves to the enzyme, altering the shape of the active site so that the substrate is unable to occupy it and the enzyme cannot function (non-competitive inhibitors). Inhibitors therefore slow the rate of reaction. They should not have affected this investigation, however, as none were added.
v) Enzyme cofactors - cofactors are none protein substances which influence the functioning of enzymes. They include activators that are essential for the activation of some enzymes. Coenzymes also influence the functioning of enzymes although are not bonded to the enzyme.
Unless enzyme cofactors were present in the potato tissue containing the Catalase, they were not included in this investigation and therefore would not have affected the rate of reaction and the results of this experiment.
vi) Enzyme Concentration - Provided there is an excess substrate, an increase in enzyme concentration will lead to a corresponding increase in rate of reaction. Where the substrate is in short supply (i.e. it is limiting) an increase in enzyme concentration has no effect.
I varied the enzyme concentration by altering the number of equal sized discs of potato that contain the Catalase, in the reaction. The greater the number of discs, the greater the enzyme concentration.
Apparatus -
Procedures - Three tubes, 10mm in diameter were bored from a potato using a cork borer. Using a razor blade and a ruler, 122 discs, 1mm thick, were cut from the tubes and placed under distilled water in a petri dish. This prevented the potato from being contaminated or dehydrated.
5ml of hydrogen peroxide and 5ml of a pH 7 buffer were then measured and added to each of six boiling tubes using a syringe. Care was taken to view the syringes from the side to ensure the bottom of the meniscus was lined up properly with the gradations and there were no air bubbles in the syringe. A pH buffer was added to the boiling tubes to maintain the pH at a constant level so that changes in pH as a result of the reaction would not affect the activity of the enzyme and disrupt the results. pH 7 buffer was selected to match the natural pH of the potato tissue and therefore suit the enzyme so that it could work efficiently.
One of the boiling tubes was then connected to a manometer containing manometer fluid using a bung (see diagram below). Holding the manometer level by the bung to ensure that the fluid was at its lowest level, a mark was drawn to indicate this point using a marker pen. A further mark was then drawn 5cm above the original, measured using a ruler.
15 pieces of potato were placed in to the boiling tube using a pair of tweezers to prevent contamination. A clamp was then placed over the rubber tubing on the bung to ensure that all of the oxygen gas released will travel up the manometer tube and not escape. Once the clamp was closed, the stopwatch was started to record the time taken for the manometer fluid to travel to the second mark. When this had been achieved the time was noted in a results table and the clamp opened to allow the gas to be released and the manometer fluid to return to its original level. Once the apparatus had been reset and any air bubbles in the manometer fluid removed, a second and later third reading was taken by re-closing the clamp and measuring the time taken for sufficient gas to be released from the reaction to force the manometer fluid back up to the top mark. By taking several readings for each enzyme concentration, it enabled me to average the results to minimise the extent of any inaccuracies. The experiment was then repeated for different quantities of potato discs (enzyme concentration) by using different boiling tubes containing hydrogen peroxide (see table below for quantities). I began with an enzyme concentration of 15 potato discs rather than a lower quantity to ensure that the apparatus was working correctly.
Observations and Measurements - In the boiling tubes it was clear that a reaction was taking place by the observation of bubbles of oxygen gas being released creating a 'fizzing' in the boiling tubes.
In order to decide how varying the enzyme concentration affected the decomposition of hydrogen peroxide, the rate of reaction was measured. To do this accurately, the time taken for a specific quantity of oxygen gas (a product of the reaction) to be released was determined. This was achieved by observing the time taken for the manometer fluid to travel between the two marked fixed points as it was forced through the manometer by the rising gas. This was an accurate measure of how the enzyme concentration influenced the breakdown of hydrogen peroxide, as the quantity and speed of gas produced is dependant on the rate of reaction. The marked points remained the same distance apart for each reading for different enzyme concentrations so that they could be accurately compared and the trend observed.
All measurements were taken so that the stopwatch was started once the rubber tubing was sealed and the stopwatch stopped once the manometer fluid had reached the base of the highest marked point. To judge accurately, the point at which the fluid reached the marked line, it was examined at eye level and the measurement taken when the bottom of the meniscus was lined up to the mark. This was the same for every reading.
Data handling - The data obtained from this investigation has been recorded in a table showing the time, enzyme concentration and rate of reaction. This means that the results of the experiment are presented in a clear and orderly fashion that allows patterns in the results to become more obvious.
The rate of reaction was calculated by dividing 1000 by the time taken for the quantity of gas to be produced from the reaction. By calculating the rate of reaction instead of merely using the time readings, the quicker reactions will be represented as a greater value for the rate of reaction rather than a small time value. This makes the graph more clear and easier to analyse.
Patterns within the results collected from the experiment, are best shown on a graph. This is because overall trends between the enzyme concentration and rate of reaction can be portrayed more effectively and become more obvious.
Limitations and Precautions - In this investigation, I measured the rate of reaction with enzyme concentrations of between 0 and 35 units (potato discs). At 0, there should be no reaction as there will be no substrate, however, I included it to act as a control. This will show that it is the variable, enzyme concentration that is being measured.
I decided to vary the enzyme concentration by varying the number of potato discs. However, although the enzyme, Catalase, occurs in the potato tissue, I did not know the exact quantity and certain discs might have more Catalase than others. This could be a major limitation in this investigation. I have tried to compensate for this, however, by taking multiple readings for each enzyme concentration so that inaccuracies are minimised once averaged.
As a precaution, I have limited my contact with the boiling tubes, as my body heat will raise the temperature, increasing the rate of reaction or expanding the gas inside the test tube moving the manometer fluid.
I also monitored the temperature using a thermometer to ensure that it remained constant and not disrupt the results of the experiment by affecting the activity of the Catalase.
A pH buffer was used to maintain a consistent pH level in the boiling tubes. This way there was no variation in pH that might have resulted in an increase or decrease in the rate of reaction.
A major limitation of this investigation was the time. It meant that only 8different enzyme concentrations could be measured at intervals of 5 units or potato discs. This means that only very general, overall trends can be identified across the results. Patterns between these values can only be approximated and are not necessarily accurate.
Safety - Laboratory coats were worn during the investigation to prevent chemicals from spoiling clothes. Care was also taken whilst handling the chemicals as hydrogen peroxide is corrosive and the manometer fluid is permanently staining. Whilst using the razor blades, care was also taken to hold them by the handle and not the blade to prevent an accident occurring.
Results - The rate at which hydrogen peroxide was broken down to water and oxygen in the presence of Catalase:
The graph "The decomposition of hydrogen peroxide in the presence of potato catalase Chart 2" shows the rate of reaction up to an enzyme concentration of 25. Up to this point the line of best fit is a straight line through the origin. This shows that without the enzyme, catalase, present no reaction takes place. It also indicates that the enzyme concentration is directly proportional to the rate of reaction for the decomposition of hydrogen peroxide in the presence of catalase (the rate of reaction increases with increasing enzyme concentration).
The other graph, "The activity of potato catalase with differing enzyme concentrations Chart 1", shows how the rate of reaction varies with differing enzyme concentrations over the whole range that I experimented with. After an enzyme concentration of 25 potato discs, the line of best fit is no longer a straight line and begins to level off. The enzyme concentration is no longer proportional to the rate of reaction, and the increases in the rate of reaction reduce dramatically.
Conclusion - The reaction was fastest at an enzyme concentration of 35 potato discs. At this enzyme concentration there were the greatest number of free active sites available to the substrate molecules so that they could be broken down.
The rate increased steadily from 0 up to a concentration of 25 and slowed beyond this point to give a "maximum level". It appears that at this "maximum level", increasing the enzyme concentration had little effect and other factors such as substrate concentration were limiting the reaction and prevented any further increases in the rate of reaction.
Discussion - The results of this investigation are as I predicted in the hypothesis: "The reaction will increase with increasing enzyme concentration when molecules of hydrogen peroxide are freely available. However, when molecules of the substrate are in short supply, the increase in rate of reaction is limited and will have little effect". The reasons for this are that there are number of variables that influence the decomposition of hydrogen peroxide in the presence of Catalase. Some of which can be classified as limiting factors i.e. the reaction is dependant or "limited" by their availability, to be able to function effectively; these include enzyme concentration, temperature and substrate concentration. All of these factors are required for an efficient reaction to take place, even when one is freely available the reaction can still be limited by the availability of the others. When I increased the enzyme concentration, it meant that there were more free active sites for the substrate molecules so that a greater quantity of substrate molecules could be broken down into products. However past a certain point, which in my investigation was at an enzyme concentration of 25 potato discs, there were many free active sites but insufficient substrate molecules to occupy them. Increasing the enzyme concentration further without increasing the substrate concentration has no effect on the rate of reaction which eventually will remain constant.
From the line of best fit on the graph "Chart 1", it is clear that some of the points do not exactly fit. They are anomalies. Although they have only slight inaccuracies, they are an indicator of possible errors in the investigation. These may have occurred in either the measurement of the quantities of the enzyme and substrate or the measurement of the time taken for the manometer fluid to rise five centimetres up the manometer tube. Another possibility was that fluctuations in temperature caused the rate of reaction to increase or the gas inside the boiling tube to expand, forcing the fluid to rise up the manometer tube. Although minimal contact was made with the apparatus during the investigation, slight undetected variations in the room temperature may have led to inaccuracies.
The precision of this experiment, generally, was very limited since insufficient readings were taken. Although the range of enzyme concentrations taken was large, the difference in enzyme concentration between each reading was too great to distinguish a value between them. For example, the rate of reaction at an enzyme concentration of 15 potato discs was 35 + or - 4. This results in an error of uncertainty of 11%
The shape of the graph is as I predicted showing that as enzyme concentration increases so does the rate of reaction. This is because at a greater enzyme concentration, there are more free active sites available for the substrate and so more products can be made in a shorter length of time. However, it is not possible to take precise readings from the graph between the plotted points since insufficient readings were taken. To be able to do this, intermediate enzyme concentrations would have to be measured so that the shape of the graph would be more exact.
Suggestions and Improvements - To create a more accurate experiment in the future, several precautions or alterations can be made:
· Instead of using potato discs that have slight variations in size, and volume of catalase, as a source for the enzyme, a 1 molar solution of the enzyme could have been diluted to create different concentrations. This way the concentrations can be measured far more accurately reducing the chances of errors in the investigation.
· In this experiment 8 enzyme concentrations were considered. However, although there was a large range, insufficient intermediate measurements were made creating gaps between the measurements where guess work is needed to predict the rate of reaction at these points e.g. point A on graph "Chart 2". In a future investigation, a far greater number of enzyme concentrations between those already recorded should be tested reducing the extent of any anomalies on a graph where the line of best fit must be drawn.
· In this investigation each reading was repeated so that an average rate of reaction for each enzyme concentration could be calculated. This could be improved by repeating the reading more frequently thus reducing the extent of any anomalies further, once averaged.
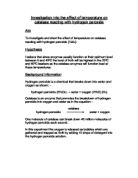
The Rate Of Catalyse Activity
Catalyse is an enzyme that breaks down hydrogen peroxide into water and oxygen.
Hydrogen Peroxide Water + Oxygen
2H2O2 2H2O +O2
The factors that affect enzyme activity are:
· Enzyme concentration (Gareth Williams, Biology For You page 31)
· Substrate concentration (Mary + Geoff Jones, Biology page )
· Temperature (Gareth Williams, Biology For You page 31)
· pH (Gareth Williams, Biology For You page 31)
Background Information
Enzymes such as catalyse are protein molecules, which are found in living cells. They are used to speed up specific reactions in the cells. They are all very specific as each enzyme just performs one particular reaction.
Catalyse is an enzyme found in food such as potato and liver. It is used for removing Hydrogen Peroxide from the cells. Catalyse speeds up the decomposition of Hydrogen Peroxide into water and oxygen. It is able to speed up the decomposition of Hydrogen Peroxide because of the shape of the Hydrogen Peroxide molecule. This type of reaction where a molecule is broken down into smaller pieces is called an anabolic reaction.
In my investigation I will study the effect of enzyme concentration on the rate of catalyse activity.
Prediction
I predict that if I increase the enzyme concentration this will increase the rate of catalyse activity because there will be more active sites for reactions, resulting in more chemical reactions caused by successful collisions between the active site of the enzyme (catalyse) and the substrate (hydrogen peroxide)
(Gareth Williams, Biology For You pages 29-31)
Equipment
10cm3 measuring cylinder
Hydrogen Peroxide
Water bath
Pureed potato
Test tube
Delivery tube
Bung
Diagram
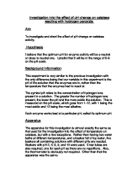
Plan
I will use the equipment as shown in the diagram to measure the amount of oxygen that gathers into the measuring cylinder. The amount of oxygen is directly related to the rate of catalyse activity. The more oxygen, the more catalyse activity and the less oxygen, the less catalyse activity. I will be able to measure the oxygen using the measuring cylinder.
I will be using pureed potato to provide the enzymes for this experiment. This is the best kind of potato to use because it has more surface area than whole potatoes and this means more active sites for the substrate to react with.I will be change the enzyme concentration(amount of pureed potato) in order to measure its effects on the rate of catalyse activity. I will perform the experiment using 0cm3, 1cm3, 2cm3, 3cm3, 4cm3, 5cm3 of pureed potato. In order to make it a fair test I must keep the volume the same for each test. The set volume will be 5cm3 so I will use water to keep the volume at 5cm3, this means that for example when I do the experiment with 3cm3 of pureed potato I will add 2cm3 of water. I will add 5cm3 of hydrogen peroxide each time in order to keep the test fair. I will use a measuring cylinder to measure out all these values. I will repeat the test at each value three times and then take an average to make it a fair test and I will also keep the temperature of the room the same throughout the experiment using the thermostatic controls in the laboratory. The temperature will remain at 20ºC.
These are the measurements I will be using.
TEST TUBE Enzyme(POTATO)(Cm3) WATER(Cm3) Substrate (Hydrogen peroxide)(Cm3) TOTAL VOLUME(Cm3)
1 0 5 5 10
2 1 4 5 10
3 2 3 5 10
4 3 2 5 10
5 4 1 5 10
6 5 0 4 10
Results
Test Tube Experiment No.1 Experiment No.2 Experiment No.3 Total Average
1 0 0 0 0 0
2 2.3 2.1 2.4 6.8 2.3
3 4.3 4.5 4.4 13.2 4.4
4 6.8 6.5 7.1 20.4 6.8
5 7.4 7.4 7.1 21.9 7.3
6 7.4 7.5 7.2 22.7 7.4
Conclusion
In conclusion I can see that my prediction was correct. The higher the enzyme concentration was, the more oxygen was produced. This is because the with higher enzyme concentration, there are more active sites where more successful collisions will take place between the active site of the enzyme and the substrate. The graph shows that as the enzyme concentration was increasing more and more, the rate of catalyse activity was increasing less an less which indicates that it was nearing the optimum rate of catalyse activity.
Evaluation
My experiment worked well although if I were to do it again I could do certain things differently in order to gain more accurate results. I would repeat the experiment more times as this would give me a more accurate average and I would also uses more different values in order to get a more detailed outlook on how enzyme concentration affects the rate of catalyse activity. I would also use a measuring syringe to measure the amount of oxygen because this is a much more accurate way of doing it.