Secondary preliminary experiment to determine shape of potato and the molarities required for my investigation:
Pilot study
A pilot experiment was conducted in which three different shaped potato tissue pieces were placed into different sucrose solutions for 20 minutes. The sucrose solutions used were 0.0, 0.25, 0.5, 0.75 and 1.0 mol dm-3, the potato pieces which had been cut into 1.5cm cubes; 4cm lengths of cylinders made with a cork borer and cuboids of dimensions 1.5 by 1 by 0.3cm, these three different shape chips had different masses to begin with: 3.6, 1.25 and 1.07g respectively.
20ml of each of the sucrose solutions were formed and placed three different potato tissues into each of the test tubes. After 20 minutes they are removed then and the scales are used to weigh the new masses of the potato chips.
The results of the secondary preliminary experiment were as follows: The table shows the final masses of each potato chip after being immersed in the different concentrations of sucrose.
The information gained from this preliminary experiment helped me to plan an appropriate strategy to obtain the most suitable results to achieve my aim in the following ways. The range of percentage change was greatest for the cylinders of potato; this is because the ratio of mass to surface area for each of the pieces of potato was greatest for the cylinders:
Mass: Surface area
Cube 1 : 3.75
Cylinder 1 : 6.4
Cuboid 1 : 4.2
This greater surface area meant that at any one time, more of the potato cells in the cylinders could be in contact with the external solution and in the specified time more of the cells could be affected by the different concentrations of sucrose. So by using potato pieces of this shape I will acquire results, which cover a larger range and will be able to get the most accurate reading of the sucrose solution of the potato tissue.
The sucrose solution at which the mass of the potato did not change was in between 0.25 and 0.55M as at 0.25M the mass either increased or stayed the same, whereas at 0.5M the mass of the potato pieces decreased. This shows that equilibrium of osmosis is reached in between these values and therefore the water potential of the potato cells is in this range. For that reason to obtain more precise and accurate results I will conduct my experiment using values of sucrose concentration between 0.25 and 0.5M.
Secondary Data:
There are 4 different set of results from different sources:
- Potato cell data from a US school
- Data from HSFC lab by Marylyn
- Data from ‘advanced biology’ – (published by Nelson in 2000)
- ‘Biological science’ (published by C.U.P in 1990)
Potato cell from a U.S school
The results show that as the molarities of the sucrose increased, the mass of the tissue decreased, which agrees with my background knowledge of the movement of the different water potentials.
The investigation showed that the incipient plasmolysed cells were at 50% between 0.4 and 0.6 molar. I will therefore use values between these two molarities to determine the water potential at equilibrium. The reliability of this source is known but it is still secondary data so its reliability is only acceptable but not convincing to use as a preliminary experiment
The results agreed with my initial prediction of the sucrose concentration increasing, meant that fewer cells were being incipiently plasmolysed each time.
Advantages of Table 1:
The experiment uses mass reducing inaccuracies, if length was used.
Range of results was good enough to find water potential
Disadvantages of Table1:
Range of results was a little to spread to find exact water potential
There is no evidence of the experiment be repeated so this is only a pilot experiment
Data from HSFC lab by Marylyn
Marylyn’s results showed a more closed spread of sucrose molarities. This meant her results were more able to establish the equilibrium point than the results of the US school.
Marylyn’s results showed the equilibrium point at 0.4 molar of sucrose where there was no change in mass of the potato cell. Marilyn’s results are reliable because she is the biology department’s technician and has a lot of experience and expertise regarding this investigation and method of conducting it.
However her method was using length as the measuring component so I cannot compare in detail the results with the US school. The trend however was the same as the US schools and that of my prediction so I think it is reliable and a good source of a preliminary experiment.
Advantages
Good spread of results
Easy to find water potential form molarity
Conducted more than once and average was found
Disadvantages
Length was used, so imprecision was higher than other tables due to potato chip length can only be measured to nearest mm (1 d.p) where as mass to the nearest gram (2 d.p)
Data from ‘Advanced biology’ – (published by Nelson in 2000)
This set of results only gives the sucrose concentration mass ratio so it is not very precise but only shows the basic idea. It also shows that equilibrium is between 0.2 and 0.3 molar of sucrose which is dissimilar to the previous two sources. It does not show any change in mass but only as a ratio so accuracy of data is not very good.
However it does agree with my prediction of the relationship of the sucrose concentration and mass changes
There does not seem to be any advantages to table 3
Disadvantages
No evidence of repetition
Use of ratios makes calculations more difficult
Not a lot detail regarding the experiment so reliability is low
‘Biological science’ (published by C.U.P in 1990)
This set of results uses length as the measuring constituent. However the length is to 1 d.p so the accuracy is poor due to results for different molarities being the same so therefore it is very hard to find any trend so to create some kind of conclusion. The range of sucrose concentration was also not very good because there was big gap between 0.2M and 0.4 M and the equilibrium point is between these two values, but it is very hard to determine where due to the imprecise range. The equilibrium point is at 0 change which means it’s between the last positive and first negative value but it is very hard to determine where it is if the sucrose concentration molarities has a poor range between each one. The experiment also showed that the equilibrium point was changing between each trial so therefore they should have used an average of the three trials and used this as the final set of results to actually be able to find or conclude any findings
Advantages
Good assortment of sucrose concentration
Use of mass increased accuracy to a degree
The use of averages increases accuracy
Use of 24h for the experiment to take place
Disadvantages
Old piece of secondary source published in 1990
Trends between the different tables:
Table 1, 2, 3 and 4 all show:
From 0.0M – 0.40 there is cell turgidity occurring as:
Solution potential > potato potential
At 0.4M and up to 0.6M there is equilibrium as:
Solution potential > potato potential
From 0.6M and above there is cell plasmolysis occurring as:
Solution potential > potato potential
Comparisons of all the Tables:
When comparing the tables as a whole, a broad-spectrum conclusion can be stated that as the sucrose concentration increases the percentage change in mass also increases until it reaches a point called equilibrium in which the both potentials are balanced and in all four tables this point is around 0.40 Molar sucrose concentration
Table 2 and 4 are easily compared as they both use length and the results are very similar, however table 2 shows a closer spread of molarities so the equilibrium point was much easier to calculate and this was at 0.4 M in Table 2 but in table 4 it is between 0.40M and 0.60M, which means the inaccuracy in determining the water potential is much greater in table 4 as range of sucrose concentration was too spread
Table 3 was difficult to compare directly with the other tables due to the fact it used ratios to show mass change. However it still shows brief detail of change in mass and it is still possible to find the molarity at which equilibrium exists. Nevertheless it is difficult to compare table 2 with other tables directly except for table 1 as they both use mass
Table 2 can only be compared directly with table4 due to fact that the independent variable is the same (length), however the overall conclusion from the experiment is still the same showing equilibrium to be at 0.40M again.
Dependability:
Considering all the advantages and disadvantages, below is the order of reliability in order from most reliable to lowest reliability:
Table 2 seems to be the most reliable
Table 4 is quite reliable reliability
Table 1 has a low reliability
Table 3 has lowest reliability
Summary:
From these findings and the preliminary experiment I am able to derive a plausible prediction that shows careful scientific application, knowledge and evaluation to create such a prediction.
From all these sources I know that the experiment in reality works so I will be expecting an encouraging result if the process is conducted well. It would seem suitable to illustrate graphs of each of the sources results but from the statistics it is still possible to analyse the data in aspect to some degree.
Prediction:
When the potato cell is placed in pure water (OM) or a hypotonic solution the cells will swell and become turgid. This is because water molecules will diffuse by osmosis through the partially permeable membrane from the region of high water potential to the region of low water potential, from the external solution into the cells. The cells do not burst when the vacuoles are filled as the protoplast (the living part of the cell wall) pushes up against the cell wall, which provides pressure to stop the cell collapsing.
When the potato is placed in a higher concentration of solute or a hyper tonic (1.0M) solution the water will move out of the cell as it performs osmosis. This will result in the vacuole shrinking and the protoplast pulling away from the cell wall, which will no longer be under any pressure. The space between the cell wall and shrunken protoplast will be filled with the external solution, as the cell wall is completely permeable.
Osmosis will occur until equilibrium is reached and the water potential outside the cell is equal to that in the cell. Therefore the water potential of the potato cells can be found by placing the potato tissue in an external solution, which produces no change in mass or length in the tissue. The osmotic potential can be found by balancing the tissue with an external solution, which produces incipient plasmolysis. Incipient plasmolysis is when pressure potential has just reached zero:
Ψp = 0 , so Ψw = Ψs
Water potential = Solute potential + Pressure potential
Ψw Ψs Ψp
Summary:
When the potato is placed in a solution with a higher water potential (less negative) the potato cells will gain in mass and when placed in a solution with a lower water potential the potato will lose mass, as the net movement of water molecules is down a water potential gradient.
I expect as the sucrose concentration increases the mass of the potato chip will decrease due to the greater water potential being in the sucrose concentration each time until it reaches a point where the equilibrium is reached and the water potential being equal in both the cell and sucrose solution. This will mean there no will be no net movement of water so the mass stays the same and the water potential then is found by reading of the molarity found.
Specific Predictions:
For OM sucrose concentration, I expect the potato to increase in mass due to the net water movement from the external solution into the potato chip and causing the potato cells to become turgid. I have derived this prediction from the secondary sources (Table 1, 2 and 4 from appendix) in which the greatest percentage increase in mass was at 0 molarity of sucrose concentration.
At 0.2M I also expect the same rapport as the cells become more turgid due to external water potential being much higher then in the cells so the principles of osmosis occur resulting in a turgid cell. Therefore at 0M and 0.2M I expect the:
Potato potential < solution potential
At 0.4M I expect a different effect in which the both the solution potential and potato potential are equal, resulting in no change in mass. This is called the equilibrium point and I believe it is at this point due to secondary sources (In Marylyn’s experiment, Table 2) I trust her results are as accurate as physically possible due to the fact she is an experienced lab technician and her results show that there is no change in mass at 0.40M of sucrose concentration. This can also be inveterated by the Data table in ‘Biological Sciences’ (Table 4)
I was capable of deriving this prediction from the preliminary experiment which in addition showed that equilibrium is between this point and (plus/minus x)
Potato potential = solution potential
At O.6, 0.8 and 1.0 Molarity of sucrose concentration, I expect the potato cells to be plasmolysed due to the fact that the water potential is higher in the cells at these molarities and thus through the principles of osmosis the cells shrink or decrease in mass as the water molecules leave the potato cell from its high water potential to a low water potential being the external solution of sucrose. This prediction is derived from the fact that all four tables in the appendix show that as the molarity of sucrose increase above 0.4M (equilibrium) the mass starts to decrease resulting in a negative percentage increase. Therefore I expect:
Potato potential > solution potential
Apparatus mandatory for this investigation:
Cork borer Forceps
Scalpel Pen for labelling
Ruler Potato
Potato peeler
Paper towels
Labels
Cutting tile
Distilled Water
10cm3 Pipettes
Sample tubes and lid
10cm3 Pipette filler
Mass Balance
Beakers
Glass Rods
1 M sucrose solution (342g of sucrose in 1dm3 of distilled water)
Whole potatoes
Modus Operandi:
-
Make up the six different sucrose solutions using the dilutions table. Use pipette fillers to transfer 20cm3 of each solution from beakers to sample bottles. Label each bottle with a white label marking the concentration of sucrose solution.
- Using the cork borer size 2, pushing down onto the tile, cut out 18 chips. Using a ruler and a scalpel measure cut each chip to 4cm. It is important to have 18 chips so that three chips can be placed in each solution and an average result can be obtained for each solution. Reduces the risk of anomalous results and produces more accurate results. Prevent handling of the chips by using forceps.
- It’s important to take the chips from a similar region of potato as different areas have different types of tissue, which may cause the water potential differ. (The shape of the potato needs to be cylinder derived from preliminary experiment)
- Remove the skin using a scalpel, as the skin is less permeable than the inner cells.
- Weigh each potato chip; using a digital balance the results can be recorded to 2 decimal places. The masses can be altered so that they are all equal by using a scalpel to shave off small slices. Record this measurement.
- Place the chips into the solutions quickly so that the reaction times are as equal as possible and start the timer.
- Place lids on the sample bottles to prevent evaporation of water, which would lower the water potential of the solution.
- After 24 hours remove the chips at the staggered intervals they were added to the solution. Blot them, dry using paper towels, blotting each chip once only, ensuring that the amount of solution removed from the surface of the chips is constant. Reweigh the chips on the same digital balance as used before. Record the results to two decimal places, as before, in a table. This ensures uniform precision throughout the experiment, increasing the reliability of the results.
Dilution table:
(These were determined by the secondary preliminary experiment which showed that these molarities were most effective fro my investigation)
Range and repeats:
For this investigation I am going to choose the following sucrose molarities: 0.25 to 0.5 molarities. In the preliminary experiment the sucrose solution at which the mass of the potato did not change was in between 0.25 and 0.5M as at 0.25M the mass either increased or stayed the same, whereas at 0.5M the mass of the potato pieces decreased.
This shows that equilibrium of osmosis is reached in between these values and therefore the water potential of the potato cells is in this range. For that reason to obtain more precise and accurate results I will conduct my experiment using values of sucrose concentration between 0.25 and 0.5M
I have chosen these because the change in mass will have greater affect between these molarities and I believe the equilibrium is between these molarities due to the preliminary experiment and the four secondary sources.
The six array of molarities I am going to use are:
0.25M 0.30M 0.35M 0.40M, 0.45M, 0.50M
These concentrations will give me a decent set of results and will enable me to work out the water potential must easier. The range/ spread are relatively small in order to find a more accurate set of results and water potential. This has been derived from the small inaccuracies from the four secondary sources that have a large spread in between them except Marylyn’s set of results which show the equilibrium point much easier.
I have stopped at 0.5 molarities for the reason that after this the mass decreases and carries on decreasing until the specific molarities causes cell plasmolysis, therefore it would make sense to stop at 0.5 because this is where there is a difference between positive and negative mass changes.
The experiment will be repeated three times as this will generate a more accurate average reading in order to avoid any anomalous results the first time!
Variables to control:
The main variables are:
- mass of potato
- surface area of potato
- time potato placed in solution
- volume of solution
- temperature of solution if possible
- same no. of potato chips for each concentration – 3
- units of measurement on digital scale
- same potato
- same region of potato
The dependent variable is the change of mass of the potato chips. This is dependent on the amount of water taken up or lost by the potato cells, and therefore the w and physical stipulation of the cells. The change in mass is the variable being observed. The change in mass can be measured using a digital balance, recorded to two decimal places, subtracting the mass of the potato before immersion from the mass of the potato chip after.
The controlled variable is the time the potato tissue is immersed in the sucrose solution and this must be constant for all the potato samples. This can be measured using a stop clock. The potato chips will be immersed in solution for 24 hours. The volume of sucrose solution is also being kept constant at 20 cm3.
The variables that can not be controlled are the temperature of the environment in which the samples are kept and small variations in the potato tissue
Justification of Equipment and any limitations:
(Marilyn the lab technician is also a supportive source of resource for any problems if they should occur at some stage in the practical area of the investigation.)
Risk assessment:
Accuracy:
Most of the accuracy in the investigation I have already discussed but below is some extra points to consider:
Limitations that are difficult to avoid:
The tissue in the potato is very inconsistent. It is visibly different in that the colour and texture of the chips may vary, some of it could be more brown and fibrous. the potato acts as a store for different substances and different regions of the potato will have different functions, therefore different water potentials. The tissue sample must always be from the same region of the potato so that t here is no varying water potential and if this is not considered this means that the results are inaccurate as the proportions of each different region could have been different.
If the tissue is less dense than the sucrose solutions ;then the tissues will float leaving an area of the surface out of the solution. This means that these cells can not be affected as much by the sucrose solutions, but would have to wait for diffusion of water through from the cells, which were immersed. This could have reduced the rate of reaction as the diffusion pathway is much greater.
The dispersion of sucrose molecules may not be constant throughout the sucrose solutions, therefore the concentration of sucrose could vary in different regions of the solution and the degree of accuracy would vary. To eradicate this, the sucrose solution should be stirred before each volume is taken from it.
Temperature would have had an effect on the water potential of the solutions, as a higher temperature provides more energy, which is needed for the molecules to be able to move. So increasing the temperature increases the free energy of the molecules, increasing the likelihood that they will move from one region to another.
Therefore the temperature would have reduced the accuracy of the results; optimally they would have been kept in a constant temperature. However, the changes in temperature, and its effect, would have been the same for all the samples and so it should not have caused any individual anomalous results.
The blotting of the chips can also cause inaccuracy. The effect of blotting on the change of mass will vary from sample to sample as it is very difficult to ensure that the same amount of excess solution is removed from each chip.
Justification of the use of mass over length:
Mass will be the measuring unit instead of length because I believe it is more accurate to use mass.
Reasons for this are that mass can be measured to 2 d.p where as length can be measured to 1 d.p so more inaccuracies will occur with the length measurements due to length measurements being the same for different molarities which is a clear inaccuracy. However with mass, any differences between masses can clearly be seen. The use of mass means scales can do the work so there will be a small inaccuracy where as length relies heavily on eye observation and this means the degree of accuracy is not very good but
Results elucidation:
Knowing the osmotic potential of the solution and knowing that the pressure potential of the solution is zero allows you to calculate the water potential of the solution. The water potential will equal the osmotic potential of the solution. Ψ = 0 + Ψπ or Ψ = Ψπ. Therefore the water potential of the solution at equilibrium will equal that of the potato cells at standard atmospheric conditions where temperature = 22oC.
Table showing change in mass of potato chips in different concentrations of sucrose solution:
* I will try to use 1.0 grams as the initial mass. It is much easier to then calculate the %change in mass.
Comprehensive Analysis of results:
I will first record my readings into the table above and then for each result I will find the molarity and find the analogous water potential of the potato cell. From this I could check if the equilibrium point is also correct with molarities which create no change in mass. This will tell how accurate my experiment is as well. The water potentials will be found using a secondary source, a book called ‘biological science’ which contains a table with sucrose concentration and the corresponding water potential.
From the results I will plot a graph of change in mass (g) against the water potential of the sucrose concentrations. And one for percentage change of mass against water potential of the sucrose concentration.
The water potential of the potato cells can be calculated from the intercept on the x-axis on the graphs. Because at this point there is no change in mass therefore it is the point of equilibrium where the Ψ is the same inside the potato cells and in the external solution. This point is incipient plasmolysis.
The x-intercept can be calculated from both graphs, however the Ψ of the potato calculated from the graph showing percentage change would be more accurate as the numbers are larger and they cover a larger range and the larger numbers will reduce the percentage error; also the initial mass is taken into consideration, although in my particular experiment the initial masses were all equal. The values should be very alike.
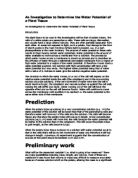
The graphs should look like the specimen below from a past preliminary experiment:
Appendix:
I have four different sources of secondary data that are required for cross referencing:
Table 1
Table 2
Table 3
Table 4
The table in secondary preliminary experiment was courteously taken from a source from the internet legally.
Bibliography:
For this investigation, I got some helpful pictures which I copied and background information from the internet and books and the rest is due to self effort:
The URL’s used:
The books I used were:
* The Complete A-Z Biology Handbook, 2nd Edition, Bill Indge, Hodder & Stoughton, pg. 287
* Biology 1, Cambridge, pg. 56
* AS Biology Revision –Letts Guide – Foundation Section
* Advanced Biology – unknown author