Therefore, my final prediction is that, if the concentration of sodium thiosulphate or hydrochloric acid changes, the rate of reaction will change accordingly. The rate of reaction is proportional to the concentration of sodium thiosulphate or hydrochloric acid.
Variables
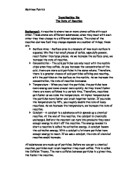
Independent variable – this is the variable which I intend to change. I am going to change the concentration of sodium thiosulphate. I will do this by diluting the sodium thiosulphate with different volumes of water.
Dependent Variable – This is the variable in which I intend to measure. I am going to measure the time, with a digital time, for which it takes a black cross placed under the conical flask to disappear due to the precipitate which forms when sodium thiosulphate and hydrochloric acid react. The time will be recorded in seconds.
I will also do an experiment to change the concentration of hydrochloric acid to find out if it matters which chemical you change.
Controlled variables - These are the variables which I intend to keep the same in order to keep the experiment fair.
- Surrounding temperature will remain constant at ambient temperature.
- The final volume of reactants added together will always be the same and hence the depth of the precipitate will be constant.
- No catalyst will be used throughout the investigation.
Accuracy and Reliability
In order to make the investigation as accurate and reliable as possible, I will use accurate measuring equipment such as a burette, which is much more accurate than a measuring cylinder, as you can read to two decimal places. Additionally, a digital timer will be used throughout the investigation because it is much more accurate than an ordinary watch.
In order to get the same depth of yellow coloured precipitate throughout the experiment, the same final volume of reactants added together will be used each time. For example 25cm of the variable concentration of sodium thiosulphate will be added to 25cm of hydrochloric acid. Hence, the final volume will be 50cm . Furthermore to make the investigation reliable, I will repeat the results and take an average each time which will be used for the graph to interpret the results.
To see how quickly the precipitate forms and hence, determine the rate of reaction, a white piece of filter paper with a black cross marked on it will be placed underneath the flask. The time that it takes for the black cross to disappear due to the formation of a yellow precipitate will determine the rate of reaction. I will view the flask down the centre through the top. This method will be more accurate in case the glassware is dirty.
Apparatus and Chemicals
Safety
To perform this experiment as safely as possible, I will wear safety goggles to prevent any acid getting into my eyes and I will also wear disposable gloves to prevent acid from getting on my skin.
In addition I will check the safety symbols on the bottles of the chemicals before I begin the experiment and I will mop up any spillages right after they occur. I will also that care not to knock over any of the apparatus as the chemicals could accidentally splash into someone’s eyes.
Method
- Collect all of the equipment displayed on the apparatus and chemical Page
- Clean all of the apparatus with distilled water, as to wash out any other chemicals
- Fill the three burettes up to 0cm³ using a filter funnel in each, making sure that each chemical is in a separate burette and that they do not mix
- Pour the needed amount of sodium thiosulphate in to a beaker
- Dispense the needed amount of hydrochloric acid into a separate beaker
- Also pour the needed amount of distilled water into a beaker
- Then mix the distilled water with the chemical that is changing concentration
- Nextly pour the chemical you don’t want to change into the conical flask, then add the other two chemicals.
- When you start to mix the chemicals, you then immediately start the stopwatch
- Swirl the contents of the beaker and place it on the black cross
- At that time stop the stop watch when the cross underneath the conical flask has disappeared.
Strategy for dealing with results
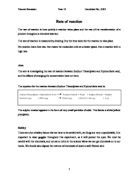
The first method I will use for the recording of my results will be in the form of a table.
A specimen table is shown below:
A table to show the time for which the black cross disappeared for each concentration of sodium thiosulphate and the calculated rate of reaction for each.
The formula for the rate of reaction;
Rate=1
t
I will draw two graphs for each experiment.
Results
A table to show the time in which the cross disappears for the different concentration of sodium thiosulphate.
A table to show the time in which the cross disappears for the different concentrations of hydrochloric acid.
From the results of both experiments I can conclude the lower the percentage of concentration of the changing chemical the slower it will take for the collisions between the particles. I know this because the rate of reaction decreases as the percentage decreases.
Interpretation
In the rate of reaction graphs, it shows a straight line this means that the rate of reaction is proportional to the percentage of concentration. I have also found that in the average time graphs, the lower the concentration of the chemical the longer it takes for the reaction to be complete. I know this because the line curves towards the x-axis.
Previous to the experiment, I predicted that if the concentration of sodium thiosulphate or the concentration of hydrochloric acid was changed, then the rate of reaction would also change accordingly. It was also predicted that if their concentration increased, then the rate would also increase and if their concentration decreased, then the rate would also decrease. Hence, it was predicted that the rate of reaction was proportional to the concentration of sodium thiosulphate or hydrochloric acid.
The results of my experiment showed this to be correct and it can be concluded that the rate of reaction was directly proportional to the concentration of sodium thiosulphate or hydrochloric acid. The reasons behind this outcome were that when the concentration of either the sodium thiosulphate or hydrochloric acid changed then the number of H+ ions and
S2032- ions also changed. As the concentration increased, then too did the number of ions of reactant which led to an increased number of collisions. The more collisions which took place, the faster the rate of my reaction. Additionally, when the concentration decreased, then the number of H+ ions and S2032- ions also decreased which led to a depleted number of collisions resulting in a slower rate of reaction.
Therefore my conclusion is, when the chemical is in a lower concentration the particles fewer ions therefore they won’t collide as other, in addition the rate of reaction will then be slower. I know this because when the concentration of sodium thiosulphate was 40% the time it took for the cross to disappear was 180.5 seconds and when the concentration was lowered to 20% the time it took for the cross to disappear was 483.0 seconds, that’s more than double the time it took for the cross to disappear at 40%.
Consequently I have answered what the title asked me to do.
I think that I used a suitable method as I used accurate apparatus which made my results more reliable. Also the equipment was easy to use and to read which makes my volumes of concentration more likely to be exact. I also think the method was easy to use as it explained step by step what to do for both experiments (change of concentration of sodium thiosulphate and also the change in concentration of hydrochloric acid).
My experiment could have been improved by taking more reading to get more accurate results. I would also use more hi-tech equipment such as a light sensor. I would place this under the conical flask and when the chemicals start to become a deeper colour of yellow the light senor will record the chance in the amount of light getting through the chemicals.
I think that my results are reliable because I used reliable equipment and also I double checked that every measurement I took was exact. Since most of my result sit on the best fit line I can also say that my results were recorded accurately. The points that are not on the best fit line are almost on the line which means that they could have been caused by a slight increase or decrease in temperature the amounts could have been taken from another bottle therefore the moles of the different chemicals may have been different.
I believe that my results are accurate enough to make a conclusion from because I have faith that I did everything I could to make my results reliable as possible. Further more I think that I could convince others that my results are accurate