To examine the effect of Substrate Concentration (Hydrogen Peroxide) on the rate of an enzyme catalysed reaction
Kevin McAllister
To examine the effect of Substrate Concentration (Hydrogen Peroxide) on the rate of an enzyme catalysed reaction
The reaction we will study is:
2H2O2 ? O2 + H2O
Catalase
Enzymes are globular proteins with a complex tertiary structure. Weak chemical bonds between the polypeptide chains maintain the shape of the enzyme, which is critical to its function. Each enzyme has a specifically shaped active site. Substrate molecules which have the same shape as the active site may combine with this active centre - forming an enzyme substrate complex. The enzyme and substrate molecules interact in such a way that a chemical reaction occurs and appropriate products are produced. This sequence of events can be repeated very rapidly. Catalase is a good example, it occurs naturally in the body tissues of plants and animals and catalyses the decomposition of Hydrogen peroxide to oxygen gas and water by up to 10,000 times.
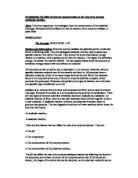
Substrate Concentration has a major effect on the rate of reaction. At low substrate concentrations many of the available enzyme molecules will have active centres which are unoccupied and the restricted supply of substrate molecules will mean less enzyme substrate complex's will form per unit of time, so the rate of reaction will be low. As we increase substrate concentration more of the active centres will be occupied so more enzyme substrate complexes will form per unit of time and therefore rate of reaction will increase. When large concentrations are used the rate of reaction will increase no longer as all the enzymes active sites' are filled so rate of reaction will not be able to increase further until concentration of enzyme is increased. This is shown by the graph below.
Effect of substrate and enzyme concentration on the rate of an enzyme controlled reaction.
We have chosen to use the effect of Catalase enzyme on Hydrogen Peroxide because this is a very easy system to use. Oxygen gas is produced, we can measure the volume of oxygen produced, and compare the rate at which oxygen is produced at different substrate concentrations to see the effect that changing substrate concentration has on rate of reaction. We will obtain results by measuring oxygen evolution in cm3/second over various substrate concentrations. If we produce graphs of these results, by measuring the gradients of the graphs we will obtain values for the rate of reaction which can then be plotted on a separate graph showing rate of reaction against concentration, this final graph will allow us to compare our results and it will enable us to answer our brief as it will show the effect of changing concentration against rate of reaction.
We will obtain the gradients for the original (o2 evolution/time) graphs by drawing a line against the curve of the graph where it begins to level off. We will then draw two more lines, one vertical and one horizontal from this line to form a triangle so we can see exactly how much Oxygen was produced over a set period of time. We will substitute these values into the equation y/x to give us the value for rate of reaction. Y is equal to the volume of oxygen produced, and x the time taken for this volume of oxygen to be produced.
We will obtain results at Hydrogen Peroxide concentrations of 20, 30, 40, 50, 60, 70 and 80% these concentrations will give us a wide range of results which will enable us to achieve our aim of finding out the effect of changing substrate concentration on the rate of an enzyme controlled reaction. Any anomalous results will be repeated to check that they are correct, Ideally the whole experiment would be repeated 3-5 times so that an average set of results could be obtained which would minimise the effect of any uncontrolled variables
H2O2 is a good substrate to use because we know how much oxygen gas should be produce. If we use 10 volume H2O2 it will give 10 * the volume of Hydrogen Peroxide that is used
I.e. if 10cm3 of 10 volume H2O2 is used 100 cm3 of Oxygen should be produced. This is useful because the same volume of oxygen will be produced in each reaction and we know when the end point of the reaction is, (when no more Oxygen will be produced) This will allow us to compare results to one another more easily. However the Hydrogen Peroxide may already be slightly decomposed so it will not give 100% of the Oxygen volume it should. Ideally fresh Hydrogen Peroxide should be used, but if this is not possible, we should use the same batch of Hydrogen peroxide for all our results as then it will have been decomposed to the same amount. The hydrogen Peroxide should be stored in cool conditions to minimise decomposition.
If 10volume Hydrogen Peroxide is used we will need to dilute it to different amounts. We will dilute the Hydrogen Peroxide with water according to the table below:
Volume of 10Vol H2O2 in cm3
2
4
6
8
9
Volume of Water in cm3
9
8
6
4
2
Final Concentration of H2O2 %
0
20
40
60
80
90
As well as ensuring that the same batch of Hydrogen Peroxide is used, so that different volumes of oxygen are not produced when different batches are used other variables must be controlled. From Previous work we know that temperature affects enzymic activity. Increased heat energy raises the ...
This is a preview of the whole essay
Volume of 10Vol H2O2 in cm3
2
4
6
8
9
Volume of Water in cm3
9
8
6
4
2
Final Concentration of H2O2 %
0
20
40
60
80
90
As well as ensuring that the same batch of Hydrogen Peroxide is used, so that different volumes of oxygen are not produced when different batches are used other variables must be controlled. From Previous work we know that temperature affects enzymic activity. Increased heat energy raises the kinetic energy of the reacting molecules leading to more frequent collisions between substrate and enzyme. More enzyme substrate complexes are formed per second, with a corresponding increase in the rate of catalysis and on the number of product molecules. Therefore the temperature of the environment surrounding the system should be kept constant so that it cannot affect the system, as it will have an effect on the rate of reaction.
We are investigating the effect of changing substrate concentration on a reaction. If this is to be a fair test with reliable useful results obtained other variable factors need to be controlled. Enzyme controlled reactions are very sensitive to many factors and are easily affected. We want to keep all of these other factors constant throughout our tests whilst we only vary substrate concentration, so we can see what affect changing this factor alone.
We have chosen to use Potato in our experiment because this catalase enzyme is present in potato and we can also easily control the surface area and quantity of potato, which is important, as these factors will affect the rate of reaction:
When enzyme concentration is increased there are more active sites available for reaction so collisions occur more frequently between substrate and enzyme, more enzyme substrate complexes form per second - so rate of reaction increases. If enzyme concentration is varied then this will affect rate of reaction. Therefore unless we control enzyme concentration we will be unable to investigate the effect of varying substrate concentration as not all our experiments will be subject to the same conditions so the test will not be a fair one. We can attempt to control the concentration of enzymes by using the same type of tissue (potato) for each experiment, and also by using a top pan balance, and measuring the mass of each piece of potato used and keeping it constant, so that the enzyme concentration is kept constant. The surface area of the Potato should also be kept the same for each experiment. If the piece of potato used in one experiment is cut into smaller pieces whilst another is left in one large lump, it will have a larger surface area. If the potato has a larger surface area, there will be a much larger area upon which collisions between substrate and enzymes can occur. More enzyme-substrate complexes will form per second and rate of reaction will increase. To control surface area we need to cut the potato we use into a set shape of the same size so therefore the surface area is kept constant and should not be able to affect the rate of reaction in our experiment. We can do this by using a potato corer, which will keep the surface area constant throughout. It is also important that we use the same potato for each experiment as different potatoes could have different concentrations of enzymes within them and also they could be of different ages, which could affect the rate of reaction.
We also know that enzymes are sensitive to pH. Different enzymes have different optimum pH values (at which they work best). pH changes away from the optimum can affect enzyme activity adversely in either of two ways. The enzyme molecule can change shape and become denatured so the active site will change shape and no longer fit to that of the substrate so enzyme substrate complex will not form and a reaction will not occur. Also in enzymes where binding sites within the active site are charged ions, some pH values are inhibitory as they cause the ions to reassociate. The enzyme can no longer interact with the substrate and so again the reaction will stop. Although I am aware that pH values can affect the rate of an enzyme controlled reaction such as the one I am studying, I think it is unlikely that pH values will vary in the experiments so I do not think that this is a factor which especially needs to be controlled.
These are all the variables that I feel need to be controlled within the experiment so that rate of reaction is not affected by anything other than substrate concentration. However I also need to record my results at regular intervals so that I can fairly compare the rates of reaction between different substrate concentrations. I will take readings of the volumes of oxygen produced every 20 seconds from immediately after the hydrogen peroxide has been added to the conical flask containing the potato. It is important that results are obtained at the same frequency so that we can see how Oxygen evolution occurs across the whole experiment. If we aim to record results every 5 seconds, then this may be hard to achieve because the gap is not large enough and also there may not be a very large difference in the volume of oxygen because the reaction will not be that fast. Similarly if the time gap between results is too large we will not be able to see how the oxygen evolution varies as we may only obtain one or two readings.
Method
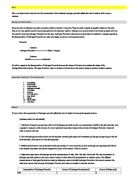
The apparatus will be set up as shown in the diagram:
A diagram to show how the apparatus was set up
Before it is used the system must be checked to ensure that no gas can escape, so that any gas produced by the reaction between the Hydrogen peroxide and the catalase remains within the system and can be measured by the gas syringe. If gas can escape then we will not be measuring the full volume of gas produced by the reaction, so it will not be a fair test. The system can be checked by filling the syringe with 10 cm3 of water and squirting it into the conical flask through the bung and tube. The gas syringe should then show a reading of 10 cm3 if there is no gas escapage from the system. If the gas syringe does not show this reading then the system should be checked again to check that no gas can escape.
.10g of potato will be weighed on a top pan balance accurate to 2 decimal places. It will be cut using a potato corer to ensure a constant surface area and placed into the conical flask. Using the graduated pipette, 10 cm3 of Hydrogen Peroxide should be obtained and placed into the syringe. Check that the Gas syringe is set at 0. Apply pressure to the syringe containing the Hydrogen Peroxide until all the contents have been added to the conical flask. Immediately start the stopwatch. Take readings of oxygen evolution from the gas syringe every 20 seconds and record them in a table. After 180 seconds stop recording results.
The entire system should then be thoroughly washed and dried, as when the experiment is repeated at different substrate concentrations if any solution from the previous experiment remains on the apparatus then the concentrations will be affected, and the test will be unfair. The above steps can then be repeated using the concentrations of Hydrogen Peroxide that have already been stated. Three sets of results should be obtained for each substrate concentration.
Apparatus
Bench mat 10 volume Hydrogen Peroxide
Goggles Water
Conical Flask Boss and Clamp
Graduated Pipette Stand
Bung and Delivery Tube Gas Syringe
2 X Syringe
I calculated gradients for the graphs I produced of my results. The gradients were all taken from the same position on the graph so they can adequately allow a comparison of the rates of reaction of different substrate concentrations. By using y/x I can produce values which show the average oxygen evolution in cm3 per second. These values for overall rate of reaction for each concentration can then be plotted on a graph, which shows me the effect of increasing concentration on rate of reaction which will allow me to satisfy my aim.
Here are the workings from the gradients:
For concentration (H2O2 9 H2O 1), 9/47 = 0.191cm per second
For concentration (H2O2 8 H2O 2), 9/49 = 0.183cm per second
For concentration (H2O2 6 H2O 4), 9/55 = 0.163cm per second
For concentration (H2O2 4 H2O 6), 6/37 = 0.161cm per second
For concentration (H2O2 2 H2O 8), 6/46 = 0.130cm per second
For concentration (H2O2 1 H2O 9), 6/59 = 0.101cm per second
Conclusion/Evaluation
As substrate concentration increases so does rate of catalysis. At higher substrate concentrations the final volume of Oxygen evolved was greater than at lower concentrations.
The graphs I produced from my results show that when Hydrogen Peroxide is added to the catalase enzyme Oxygen is produced much more rapidly at the start of the reaction than at the end.
For concentration H2O2 4 H2O 6, at the start of the reaction oxygen is produced at the rate of 0.16 cm3 per second but towards the end of the reaction, Oxygen is only evolved at 0.04cm3 per second. This shows that at the start of the reaction oxygen is produced 4 times faster than towards the end of the reaction. This is also true for the other graphs I plotted for the lower substrate concentrations. At substrate concentration 20% at the start of the reaction Oxygen was evolved at a rate of 0.13cm3 per second, at the end of the reaction only 0.041 cm3 per second showing catalysis is over 3 times faster at the start of the reaction than at the end. At substrate concentration of 10% oxygen is evolved at a rate of 0.1cm3 per second at the start of the reaction, but at only 0.2cm3 towards the end - showing catalysis is nearly 5 times faster at the beginning of the reaction.
However for higher substrate concentrations this is untrue. At 90% oxygen is evolved at 0.2 cm3 per second at first yet towards the end of the period we timed the reaction for, oxygen was still being produced at 0.12 cm3 per second, only 60% slower than when the substrate was first added to the enzyme. This shows us that oxygen is still being produced quite rapidly by these higher concentrations, as there is still quite a large amount of unreacted substrate left. This would also explain why the graphs for the results at higher concentrations do not 'level off' as much as the graphs for the lower concentrations do. At substrate concentration 80% Oxygen is only evolved 90% slower at the end of reaction.
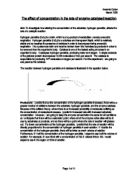
The rate of reaction graph I produced from the results graphs show us that at lower concentrations of Hydrogen Peroxide, increasing the substrate concentration is proportional to the amount of oxygen evolved. When Hydrogen peroxide concentration is doubled from 1cm3 to 2 cm3
Oxygen evolution increases by 0.03 cm3/second. The same is true when Hydrogen Peroxide concentration is doubled from 2 to 4 cm3. However after this point no proportionality exists. As substrate concentration is increased from 40% to 80% of the original concentration Oxygen evolution only increases by 0.02 cm3 showing that further increases in substrate concentration do not have as greater effect at higher concentrations as they do at lower ones.
This is because at low substrate concentrations many active sites are available, so rate of reaction will increase up to a certain point - as substrate concentration is increased, as substrate concentration is the limiting factor. However when the substrate concentration is increased so that all the active centres are occupied and the enzyme is saturated, the rate of reaction will increase no more, even if the substrate concentration is increased further. At this point the reaction had reached its maximum rate and the concentration of enzymes has become the limiting factor.
I have shown that catalysis was much more rapid at the start of a reaction than towards the end. This is because when the substrate is first added to the enzyme, many substrate molecules are available, so collisions between substrate molecules and the active centres are very likely. This means a lot of enzyme-substrate complex form per unit time and a lot of oxygen is produced at the start of the reaction. Towards the end of the reaction, many substrate molecules have already been used up, so there are less available to react with enzymes. Less enzyme substrate complex form per unit time and therefore the amount of oxygen produced per second is much less toward the end of the reaction than it was at the beginning. This is shown by the graphs I produced from my results. If substrate concentration of 40% is studied, at the start of the reaction oxygen is produced at the rate of 0.13 cm3 per second but towards the end of the reaction, Oxygen is only evolved at 0.04cm3 per second. Because we are studying the rate of decomposition of Hydrogen peroxide we must also notice that water as well as oxygen is produced when the hydrogen peroxide is produced. Water will dilute the concentration of the substrate further. Because it is quite similar in shape to the hydrogen peroxide the water molecules may also act as a competitive inhibitor to slow down the rate of reaction. This would also help to explain why the rate of reaction is much slower towards the end of the reaction.
I predicted that as concentration increased so would catalysis. I showed a predicted graph, which showed. At low substrate concentrations many of the available enzyme molecules will have active centres which are unoccupied and the restricted supply of substrate molecules will mean less enzyme substrate complex's will form per unit of time, so the rate of reaction will be low. As we increase substrate concentration more of the active centres will be occupied so more enzyme substrate complexes will form per unit of time and therefore rate of reaction will increase. When large concentrations are used the rate of reaction will increase no longer as all the enzymes active sites' are filled so rate of reaction will not be able to increase further until concentration of enzyme is increased. This has been proved by the rate of reaction graph I derived from my results. However when we study this graph there appears to be an anomalous result, which I have circled on the graph. The rate of reaction for the 60% substrate concentration appears to be much lower than it should be. This has probably occurred due to an uncontrolled variable. The results for the 60% concentration were obtained first, and this could have affected the rate of reaction. There may have been some solution from a previous experiment remaining in the equipment, this could have affected the concentration of the substrate within the conical flask and therefore slowed the rate of reaction down. However if the solution was acidic or alkaline, it's pH could have affected the rate at which the enzyme operates. pH changes away from the optimum can affect enzyme activity adversely in either of two ways. The enzyme molecule can change shape and become denatured so the active site will change shape and no longer fit to that of the substrate so enzyme substrate complex will not form and a reaction will not occur. Also in enzymes where binding sites within the active site are charged ions, some pH values are inhibitory as they cause the ions to reassociate. The enzyme can no longer interact with the substrate and so again the reaction will stop. This would not have affected other results, as the equipment was washed between use. If we were to repeat the experiment, we would wash all equipment before it was used so that it could not affect our results.
There were very few anomalies on the graphs we produced directly from our results. The reading after 60 seconds on the 60% concentration graph appears to be slightly lower than it should be, this could be because the gas syringe had become slightly stuck so the oxygen produced was not pushing the syringe out.
The readings taken at 140 seconds at 80% substrate concentration appears to be higher than it should be, this could be because the equipment was accidentally knocked during the period before the reading was taken. This would have shaken the contents of the conical flask up and increased the rate of catalysis, as the potato tubes may have floated in suspension for a while when the equipment was knocked. This would have exposed a greater surface area of the potato. Therefore, there will be a much larger area upon which collisions between substrate and enzymes can occur. More enzyme-substrate complexes will form per second and rate of reaction will increase.
Although there were few anomalies, there were limitations to the experiment. The equipment I used was not 100% accurate. The balance we used to weigh the potato was only accurate to two decimal places so there could have been an error of 0.625%
(0.01/1.6) x 100 = 0.625%
A graduated pipette is only accurate to around 0.25%, and the syringe we used to add the enzyme to the system was completely inaccurate and we had to calibrate it by using the graduated pipette. The gas syringe sometimes got stuck, and therefore oxygen being produced was not being recorded. Although we wished to use the same potato to obtain all our samples from, this was not possible. We had to use different potatoes as one potato could not provide us with enough tubes. Different potatoes could have different concentrations of enzymes within them and also they could be of different ages, this could affect the rate of the reaction. When the substrate was added to the system, although 10cm3 of Hydrogen peroxide had been added to the system, sometimes the gas syringe showed a reading of less than this value. This was because the gas syringe required the pressure within the system to be sufficient before it would be pushed out. The gas which is unaccounted for has been used to increase the systems' pressure so that the gas syringe will operate.
We could also not tell how far the Hydrogen peroxide had decomposed. If we were to run the experiment again, I would first run a 10cm3 sample of the 10-volume hydrogen peroxide with a high catalase concentration over a period of about an hour in a closed system. This would show us how much Oxygen was being produced, and because we know 100cm3 of oxygen should be produced we could calculate the purity of the Hydrogen peroxide. I would then obtain results over a wider range of concentrations, to see if the conclusions I have drawn from this small set of results are consistent over a wider range of samples. I would also investigate to see if the same conclusions can be applied if the substrate concentration is the constant factor and the enzyme concentration varied, as in theory they should.