We can find the rate constant k by plotting a graph of rate against concentration.
Variables
Safety
Apparatus
Instruments:
- retort stand
- measuring cylinders × 2
- burette
- marked test-tube
-
10 cm3 pipette
-
20 cm3 pipette
- conical flask
- funnel
- stopwatch
- beakers
Chemicals:
-
1M H2SO4
- 0.1M KI
- starch solution
- deionised water
-
0.1M Na2S2O3
-
‘2 volume’ H2O2
Diagram
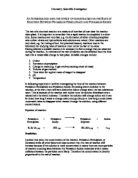
Procedure
- Prepare five chemicals:
-
1M sulphuric acid (H2SO4)
- 0.1M potassium iodide (KI)
- Starch solution
-
0.1 sodium thiosulphate (Na2S2O3)
-
‘2 volume’ hydrogen peroxide (H2O2)
-
Take the following volumes of each of the chemicals, adding deionised water to make the total volume of the solution a constant value 145 cm3. Use the following equipment for the measurement of the chemicals.
- Take the measured chemicals 1 and 2 in a beaker, 3 and 4 in another separate one, and 5 and 6 in yet another beaker
- First mix chemicals 1 and 2, and 3 and 4, into a conical flask.
-
Then mix the 5 and 6 into the solution and immediately start the stopwatch. Swirl the solution only once and record the time it takes for the solution to turn blue.
- Repeat the experiment, taking other values for volumes, such as in Expt A to E.
Data Presentation
Data Processing
There were a few uncertainties in the equipment that we used. At first, the systematic and random error values must be calculated. The uncertainties were given on each of the measuring instruments that we used.
Total uncertainty is calculated by:
It is necessary to find the order of the reaction first in order to find the value for the rate constant k. For that we need to plot the graph of concentration/time.
The half-life of a substance is the time it takes for half the amount of substance to decay. From the graph, we can find out the half-life of the substance. The two half-life values obtained from the graph for t1 and t2 are approximately:
-
t1 = 13.97 seconds
-
t2 = 12.63 seconds
Thus it can be concluded that the I2/H2O2 reaction is a first order reaction. Thus half-life of the substance depends upon the concentration:
When a Rate/Concentration graph is plotted, a straight line is obtained. The gradient of the straight line gives the value of the rate constant, k.
The rate constant k for the reaction is about 0.0222 because the gradient gives that value.
The units for the rate constant are:
Therefore, the value of k is.
Error in measurement:
Percentage error (%) = 3.20%
Therefore, 3.20% of 0.0222
≈ 0.0007
Therefore the rate constant = 0.0222 ± 0.0007
Literature value = 0.018
Therefore, total error =
Conclusion
By plotting a graph of volume against time, we can find the half-life of the reaction. The graph was found to be a curve with a constant half-life. This indicated that the reaction was a first-order reaction.
The error in this reading can be caused mainly by human errors in taking readings or using wrong methods – example, it could be difficult to time the reaction properly. Taking an average is a good way to reduce this error.
By plotting a graph of rate against concentration, the rate constant k was found to be about 0.0222. Here also the error in measuring time would give wrong readings of the rate constant. The percentage systematic error was found to be quite small. There could have been an error in calculating the percentage error. However, the error between the experimental and literature values is very large: 23%. Even the error bars of the systematic error of 0.0007 do not compensate for the error. This could be due to faulty equipment.
- For further experiments, investigate the effects of performing the experiment at different temperatures.
- Investigating effects of using a catalyst in the reaction
-
Investigating the breakdown of NH3 into N2 and H2
Evaluation
The systematic errors can be reduced by:
- using more accurate equipment, for example, a more accurate stopwatch
- error could also be caused when the human eye does not record the colour change early enough to close the tap of the burette
Random errors can be reduced by:
- taking the readings a few times and taking an average
Bibliography
-
Peter J. Nassif, Centre for Polymer Studies [online], [Accessed September 1, 2005], Available from “http://polymer.bu.edu/projects/12_pn/Kinetics.doc”
-
Enthalpy of Formation of Magnesium Oxide, [Accessed August 20, 2005], Available from http://oxygen.chem.uidaho.edu/ifcchem111/LabMaterials/enthalpy.pdf”
-
[Accessed September 2, 2005] Available from “http://www.madsci.org/posts/archives/oct98/904881510.Ch.r.html”
-
[Accessed September 2, 2005] Available from “http://www.chemistry-react.org”
-
E. N. Ramsden, A-Level Chemistry, Singapore
-
C. S. Toh and Thomas Chong, Study Guide for Your A-Level Chemistry, Singapore