Another factor, which affects water potential, is pressure potential. Pressure potential occurs, when more pressure is applied to one side of the net movement of water, than the other. The greater the pressure applied, the greater the tendency for water molecules to be forced back from the solution of which pressure is applied, to the other, where the net movement of water molecules came from. Increasing the pressure potential increases the water potential. Pressure potential is given the symbol ψP. Pressure potential makes the water potential less negative and is therefore positive.
The equation for water potential is shown below: -
ψ = ψs + ψp
Prediction
From the scientific knowledge, it is evident, that osmosis will be taking place across the cell membranes in the potato cells. The cells in the potato will be similar to the plant cells explained previously in terms of how osmosis occurs. Therefore water molecules will diffuse into the potato chip, if it is put into pure water. Also it’s expected of water molecules to diffuse out of the potato chip, if it is put into a concentrated sucrose solution. This is because there must be a considerable amount of water in the potato cells already seeing as a potato is a root vegetable and absorbs water from the ground. The net movement of water occurs, to form equilibrium of water both inside the potato chip and in its surroundings. As the water molecules move in or out of the potato chips, their size and mass will be affected. For example if the potato chip gains water molecules, it will become turgid, as explained in the scientific knowledge, as its vacuole will be putting pressure on the cell wall. This means its size will be of a different shape, thus of a different length than at the start of the experiment (1 cm³). It would also gain in mass, as the water molecules moving into the potato chip cell, will consist of a certain mass, it wouldn’t be lost. Therefore, the opposite would happen when water molecules in the cell, surrounded by higher concentrations of sucrose solution, will move out of the cell. The cell would become flaccid, and would loose its original shape and size, and its mass would also be different, it would be smaller. This is because the cells original mass also consists of water molecules, so when they are lost, they take their relevant mass with them.
Apparatus
Top pan balance – this would be used to weigh the potato chips mass before and after they were put into the different sucrose solutions in the test tubes. Using a balance means the mass change can be identified, and so the outcome of the experiment could be clear. E.g., if a potato chip put in pure water gained in mass, from this, one would know that the water molecules moved into the potato cells, when thy were put in such conditions.
Test tube racks – three of these were needed, to hold the test tubes upright during the whole experiment. This is so the solutions didn’t get spilled out.
Cork-borer – one of these were used, to cut the right sized potato chips (1 cm³). This equipment ensures that all of the potato chips are the same size, thus ensuring this part of the experiment is fair.
Scalpel and ruler – one of these were used, with a ruler; to cut the potato chips 1 cm long, this again ensures all of the potato chips being the same size, thus ensuring a fair experiment and outcome.
Measuring cylinder – two of these were used, one for measuring the right amount of water, and another for measuring the right amount of sucrose used, to make the different concentrations in molar. They were both 10 cm³. Using measuring cylinders means that the right amount of solution/concentration is made in each case. This increases the chance of fairness of the experiment overall.
Potatoes – these were used, to get the potato chips, thus the potato (plant) cells needed for this experiment.
Sucrose solution – this sucrose solution, was used to make the right concentrations needed in each case. It was mixed with distilled (pure) water, to make the different concentrations, 0 M, 0.2 M, 0.4 M, 0.6 M, 0.8 M and 1.0 M.
Distilled water – this was mixed with the sucrose solution to make the different concentrations, 0 M, 0.2 M, 0.4 M, 0.6 M, 0.8 M and 1.0 M.
Test tubes – 24 test tubes were used, four for each concentration, to ensure an accurate mean, could be conducted from the results and outcome of the experiment.
Paper towel – this was used to dry off the potato chips before each time they were weighed. This is so no excess matter would be part of the potato chips mass; so only the ‘real’ mass would be weighed. This is also to ensure that the same conditions are applied to each potato chip, so the overall outcome and experiment can be fair.
Tweezers – they were used to pick up the potato chips from the test tubes so their mass could be weighed using the top pan balance.
Labelling stickers – these were used to label and number each test tube; this is so they could be identified easily when needed.
Diagram
On the previous page, there’s a diagram of how the experiment was set out.
Method
- Collect all apparatus.
- Tie back long hair.
-
Use the hole-borer, to cut some potato tubules, and then use a knife to cut the tubules into 1 cm long chips.
- Weigh each chip, using an accurate balance, and record their mass
- Place each chip into its labelled test tube.
- Then add 10 cm³ of 1 mole of sucrose solution, (however don’t add any distilled water, as you’re making a concentration of 1 M), to four of the test tubes containing the potato chips.
- Then add 8 cm³ of 1 mole of sucrose solution, and 2 cm³ of distilled water to the next four test tubes containing the chips, to make a concentration of 0.8 M.
Above is a table, showing how much sugar (sucrose) and water (distilled) was needed to make each concentration.
- Do this process until you’ve done the concentrations of 1 M, 0.8 M, 0.6 M, 0.4 M, 0.2 M and 0 M.
- Leave the 24 test tubes, containing the chips for 24 hours.
- Pour out the liquid.
- Using paper towels, carefully remove any excess liquid from the potato chips, to ensure that when you record the final mass, the excess water won’t cause any of the weight.
- Place each chip on the balance, weighing its final mass.
- Do this for all of the chips, and record the results.
Safety
For safety, you should tie back your hair, and ensure that you handle the scalpel with care when cutting the potato chips. In general this is a fairly low risk experiment. Sucrose is purely a sugar solution, therefore it is not an irritant or explosive. So there’s no reason to wear safety goggles. A lab coat would be advisable to protect ones clothing from spillages. A lot of equipment is made from glass; therefore care must be taken to prevent these from falling and smashing. If such an accident were to happen simply use a dustpan and brush to clean up (not hands). Keep stools under tables when not in use and clear up any spillages quickly particularly those on the floor.
Fair Test
Make sure that there’s exactly 10 cm³ of solution in each test tube, containing the potato chip. Also repeat the experiment for each concentration at least three times, and use the average measurement.
Result
Analysis
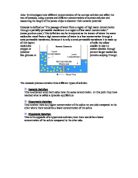
From the graph plotted on page 9, the main aspect that I found was the point at which no osmosis took place. This is the point where the line of best fit crosses the X-axis. It’s the point where there’s neither an increase nor decrease in the mass of the potato so there would have been no movement of water molecules across the potato cells into or out of the sucrose solution.
The line of best fit crosses the X-axis in between the readings for sucrose solutions of concentration 0.30 M and 0.40 M. When a straight line is drawn between these two points, the X value when the line crosses the X-axis is 0.32. This indicates that the sucrose concentration of the potato is 0.28M. For reasons including to identify anomalous results and to distinguish a trend in the movement of water molecules, the line of best fit will be used to analyse the results plotted and so 0.32 M will be taken as being the concentration of the potato. The point, at which the line of best fit crosses the X-axis, is called the incipient plasmolysis, because equilibrium is reached, so no net movement of water is diffusing out or into the potato chip.
The overall trend of the graph is that as the molarity increases, the percentage change of mass decreases, thus the potato chips mass decreases as they are put in concentrated sucrose solutions.
The graph on page 9 shows that in the 0.0M and 0.25M concentrations, there is higher water potential in the distilled water and 0.25M solutions than in the potato, which has a high concentration of solutes. This is why the water diffuses by osmosis down the concentration gradient from high concentration of water molecules, to low concentration of water molecules, resulting in the potato gaining mass.
The opposite occurs in the solutions where the molarity is higher 0.5M, 0.75M and 1.0M, the potato in these concentrations looses some mass, because there is a higher concentration of water inside the potato than in the solutions, therefore the water diffused out of the potatoes by osmosis, down the concentration gradient and into the solutions outside, this resulted in the loss of mass.
So as the molarity increases, the potato chip suffers from more mass loss (becomes flaccid). And as molarity decreases, the potato chip gains mass (becomes turgid). This shows that osmosis is proportional, net movement of water only occurs when there isn’t equilibrium. This process is proven in the scientific knowledge.
As water molecules diffuse into the potato chip, more pressure is applied to its cell wall, this adds to water potential, as the pressure potential is increased.
Another important fact is that the graph makes a shape that will result in the potato not being able to take in any more water or lose any more. Like said in the prediction, the cell wall causes the pressure that prevents this from happening.
On the graph, the point where the line of best-fit crosses, has been marked, it’s the place on the axis where the potato neither loses mass nor gains mass. This happens at 0.32 M; therefore the contents of the potato cells in molar strength are 0.32 M. This also means, that I can conduct, that the water potential at that stage is –880 kPa. This was found out, using a reference graph, showing all of the water potential values, at different concentrations of sucrose solution.
A negative percentage change in mass showed that the water potential of the sucrose solution outside of the potato chip was less than that inside of it. Hence resulting in the water molecules net movement going out of the cells, therefore a loss in mass would be logical. A positive percentage change in mass showed that the water potential of the sucrose outside the potato chips was greater than that inside of it. Therefore the net movement of the water molecules was moving into the cells, a gain in mass would also be logical. This has previously been proved, the laws of osmosis state ‘the net movement of water molecules from an area of high water potential to an area of low water potential’.
The graphs show the basic concept of as the concentration of sucrose gets higher the smaller the positive change in percentage mass and the greater the negative change in percentage mass. This is due to the water potential of the sucrose solution getting lower, and hence resulting in either a decreasing net movement of water molecules into the potato chips, or an increasing net movement of water molecules out of the potato chips. This happens because the water potential of the sucrose solution is getting increasingly smaller than that of the plant material.
Evaluation
As predicted, water molecules inside the potato cells, mobbed out by osmosis, when they were surrounded by higher concentrations of sucrose solutions. And water molecules moved into the potato cells, when a lower concentration of water molecules were present inside the cells, than outside of them. This is proved by the graph on page 9, which suggests by its line of best fit, that this is the case, hence the gradual loss of mass.
The way this experiment was conducted, was straightforward, and seemed quite a suitable and logic way of finding out how plant cells would act, when put in different conditions, e.g. in pure water and in sucrose solution. The choice of leaving the test tubes for 24 hours, meant that osmosis had time to perform, more time wouldn’t have been necessary, as water molecules would move as soon as possible. Its evident that the choice of method, is accurate and responsible for this experiment, as overall the outcome has been as expected. There doesn’t seem to be any limitations present to the outcome, of how the experiment was conducted. The way the experiment was conducted maximised the chances of the outcome/results being fair and accurate.
In order to make the results more reliable, a repeat of each test at each concentration was taken. Finding the average of these would diffuse any errors from anomalous results. While on the subject of anomalous results, two of the points when plotted on the graph on page 9 strayed from the line of best fit. One at the concentration of 0.4 M (-16.00 % change), and another at the concentration of 1.0 M (-7.27 % change). These could be present as a cause of a number of reasons. For example, it’s possible that the wrong portions were used to make up the two concentrations, the distilled water and sucrose solution didn’t add up to 10 cm³, but to more or less. The potato chips could have been the ‘wrong’ size to begin with, if for example they were cut to the wrong size, or if their mass was recorded wrongly.
I consider the experiment and investigation; to have gone the way I expected it to without any major errors or disturbances. However, even though it may have seemed to go to plan, there is still the underlying question of how accurate and more importantly how reliable the tests and the results are.
Several factors could have affected and introduced errors into the accuracy of the testing. The surface area is the first. Being able to cut all the potato chips so that they had the exactly the same surface area would be very hard and so there may have been some deviation. Surface area affects the rate of osmosis so if 24 hours was not enough to allow full osmosis to take place then the surface area should be taken into account as an erroneous factor. This is because of human error; it’s not possible to measure each potato chip using a ruler, to exactly 1 cm.
The concentrations also need to be very exact for each of the four test tubes used at each concentration. Otherwise the average value used to plot the graphs, wouldn’t be very fair and accurate. The concentrations wouldn’t be exactly the same, because the overall solution in each test tube has to be made up to 10 cm³, this isn’t possible even when using a measuring cylinder.
The recording of the masses of the potatoes would also be severely flawed. During the time lag between weighing and using the potato there could have been a loss in mass due to evaporation of moisture or water being absorbed out of the potato by contacting surfaces. Since the differences in start and finish mass are quite small, the loss of water from the potatoes before and after osmosis would have a visible effect.
Other limitations affecting the results, were the temperature at which the experiment was left, so osmosis could take place. The best temperature would be at the body temperature (37ºC). This is because enzymes also work best at this temperature in the body, as if the temperature was lower, there wouldn’t be enough energy for the enzymes to collide, and if the temperature is too high, the enzymes active site could denature, and wouldn’t function properly, as the bonds holding its tertiary structure together are broken.
If the potato chips are from different potatoes, this could also affect the overall results. As each potato is planted from a different place, one of them could have more water molecules inside of it, than another. One could be ‘older’ than another potato, thus it wouldn’t be very effective to use such a potato, these are all factor affecting the result and outcome of this experiment.
The experiment could have been extended, to a more exact level by looking at the potato cylinders under a microscope, and then one would be able to see the cells in greater detail and draw some more observational results.
If another chance were given, to repeat the experiment the method itself wouldn’t be changed, to find the sucrose concentration of the potato since this seems like a practicable method. However, in extension to the task, the mass of the potatoes could have been recorded at equally measured intervals throughout the duration of the osmosis process. This would be done, so more fairly mass values could be used to plot the graphs, thus making the graphs outcome more reliable.
The use of a best line of fit could also be avoided in future, as it isn’t as reliable as one would want it to. Its like an average, and averages are only as accurate as they can be, they aren’t a 100 % correct. This could also be said for all the other averages taken such as the average changing mass, and average mass.
When drying off the excess water on the potato cylinders after the experiment and before weighed, a paper towel was used. This might have either taken some water out of the potato or it might of left some excess water on the potato. This part of the experiment is difficult to come up with an accurate and fair method, as other ways would also lead to some slight mistakes.
Other improvements to the procedure of the experiment could be to keep all of the test tubes refrigerated, this is to help the preservation of moisture (water molecules).
AS Biology Coursework – Deyar Yasin