The results of my second experiment were much better than the first. They were better because some of the variables that were not controlled in the first experiment were controlled in the second. The measurements looked more correct to my prediction. Thus the experiment was more successful.
The results of these two experiments are listed below:
As you can see, the second results reflected my prediction better than the first. The turgidity of the potato cells decreased as the concentration of the sugar solutions increased.
Now that I am aware of the many variables, the things to watch out for and the things not to do, I am ready to conduct my real experiment.
Apparatus:
1. mini test tubes ×10
2. test tube rack ×2
3. test tube stoppers ×10
4. measuring weight (cork, plastic container, water, pins×2)
5. potatoes
6. potato borers
- measuring cylinder
- towel
- ruler
- knife
- safety goggles
- stopwatch
- solutions (distilled water, and 0.25, 0.5,0.75, 1M of sugar solution)
- beakers
Variables:
There are many variables present that could affect my results. They are listed below:
- type of potato
- length of the potato chips
- concentration of sugar solutions
- time that chips are left in test tubes
- amount of solution put into test tubes
- weight and size (fatness) of potato chips
- temperature of room, solution etc…
Experimental Variables:
I will only use one variable; the concentration of the sugar solutions. This is the only variable I need to change in order to test my hypothesis and gain reliable results.
Fair Test:
I have used 10 tubes (2 tests) to gain more results. This will make my findings more reliable. To make the test fair, all the other variables will be controlled by keeping them the same. Only the concentration of the solutions will vary.
Measurements:
Before I put the potato chips into the solutions, I will first need to make sure that the test tubes contain the equal amounts of solution. I will use a measuring cylinder to fill each test tube with exactly 35ml of solution. Each of the potato chips will be cut carefully into equal lengths with a knife after they are bored. I will measure the time that the chips are left in the test tubes (40 minutes) with a stopwatch. The mass, in grams, of the potato chips will measured using a triple balance. The measurements that will determine the turgidity of potato cells will be done using a centimetre ruler. In order to find out how turgid the potato cells are, or how turgid the cells have become, I will be measuring the flexibility of the chips. The more flexible the chips are the more flaccid or less turgid they are. Therefore the chips that are the highest off the ground are the most turgid. Since there is no real way of measuring turgidity, I will be using this method, which is my own. A more turgid potato chip will have a larger reading than a less turgid potato chip. This was proved correct and reliable enough to be put into scientific use, from the preliminary work.
Method:
- Use the potato borers to cut 10 potato chips.
- Use a knife to cut the potato chips into the same lengths.
- Weigh each chip. Record.
- For each chip, pin it to the measuring weight like in the diagram shown.
- Measure the distance between the ground and the tip of the potato chip. (This will show how turgid or flaccid the potato cells are). Record the distances.
- Fill 5 test tubes with 35ml of the solutions (distilled water, 0.25, 0.5, 0.75, 1M).
- Repeat this with 5 other test tubes. (2 tests)
- Put the potato chips (10) into the solutions at the same time. Start the stopwatch as the potatoes are inserted.
- Put a stopper onto each test tube. The experiment should now look like this:
- Leave the chips in the solutions for 40 minutes.
- After 40 minutes, take the chips out of the test tubes and dry them with a towel.
- Weigh each chip. Record.
- For each chip, pin it to the water weight like in the first diagram.
- Measure the distance the tips of the chips are to the ground. (This will show if the potato cells have been affected). Record the distances.
Safety:
Before carrying out my experiment, I have checked with my teacher, Mr. Grady, that it is safe to do so. Since knives are to be used, goggles will be required to be worn for a safety precaution.
Obtaining Evidence
Observations:
- The potato chips in the 0.75M and 1M solutions were floating in the test tubes while the other chips were at the bottom of their test tubes.
- The chip that was put into the distilled water test tube was the stiffest. The chips got limper as the concentration increased.
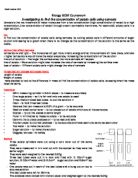
Results:
The first table below shows the turgidity of the potato chips before and after they were put into the test tubes of different sugar solutions. The lengths of the chips were 8.4cm. The chips were left in the solutions for 40 minutes.
The table above shows the mass of the potato chips before and after they were put into the test tubes of different sugar solutions. The potato chips which were all equal in hardness and mass now varied.
Analysis:
The turgidity of the potato cells was definitely affected by the different concentrations of sugar solution. The line graph shows how the potato cells became more flaccid as they were put into more concentrated sugar solutions. The range of the measurements was 5.2cm, from 6.7cm to 1.5cm. The average decrease in turgidity in 1M of sugar solution was 4.9cm. Both tests showed the continual decrease of the turgidity of potato cells. There was a negative correlation between the turgidity of the potato chips and the concentration of the sugar solution. From the line of best fit (y=-4.9x+6.99), it can be predicted that after a potato chip is taken out of a sugar solution of 1.45M, the chip should be so turgid that it would touch the ground.
The mass of the potato chips have obviously changed when they were put into stronger and weaker sugar solutions. The two tests were almost identical indicating that the mass is affected by the surrounding medium. The range of in mass is 0.6g, from 5.8g to 5.2g. The average decrease in mass in 1M of sugar solution was approximately 0.5g. The equation for my line of best fit is y=-o.58x+5.77. This is very useful in predicting in-sample and out-sample values. I can predict that for the mass of the potato chip to decrease by a whole centimetre, the chip needs to be but into a sugar solutions of about 1.7M. There was a negative correlation between the mass of the chip and the concentration of the sugar solution.
Conclusion:
I can conclude that the turgidity of potato cells is affected by the surrounding medium. The turgidity decreases as the concentration of the surrounding medium increases. This is because water from the weaker solution passes into the stronger solution. The fact is shown in the experiment results, which indicates that my prediction was correct.
I can also conclude that the mass of the potato chips is also affected by the differently concentrated solutions. As water passes out of the chip, it loses water and therefore, mass. Inversely, as water enters into the chip, it gains water and therefore, mass.
Evaluating Evidence
Evaluation of Method:
The method that I had chosen to use was appropriate. The useful findings reflected the suitability of the method. I think that my method was a good enough one to produce the results that I expected to get. There were many changes from my preliminary work but all for the better, which is why the results obtained in the real experiment, was better than the preliminary ones. Some minor changes could be made to the way I conducted my experiment to slightly improve my results:
- Use filter paper to dry the potato chips
- Leave the chips in the solutions for a longer time
- Use larger (longer and wider) potato chips
It was an overall successful method that contributed greatly to the whole success of the investigation.
Evaluation of Results:
The results that were obtained were very reliable and accurate. They can be easily used to prove that my hypothesis was correct. The factors (change in turgidity and mass) that I was looking out for were clearly exposed. Any anomalous results that were obtained indicated that a variable should have been controlled better but I do not believe that there were any abnormal results in my experiment. My results were good enough to support a firm conclusion. Both graphs showed a negative correlation between the two variables.
The changes that were mentioned above may improve the results but these are not necessary, for a valid conclusion has already been drawn. I can suggest further work that would extend my investigation. To see if osmosis occurs not only in sugar solutions, potato chips can be put into saltwater solutions. The turgidity of the potato chips is then measured the same way. Work can be conducted to test the type of solution that a potato would grow best in. Now since we know that water can be passed through cells, an investigation can be carried out to test the effects of plasmolysis and how cells become plasmolysed. We need not always use potatoes.
Since there is no real way of measuring turgidity, I will be using my own method. A turgid potato is one that is hard and stiff because there is more water inside the cells. Therefore when I measure a turgid potato chip, the distance (in centimetres) between the tip of the chip and the ground would be further than a less turgid potato chip. A potato chip that is not turgid will limp because of the lack of water inside its cells. This means that the distance measured will be small. From this knowledge, I can say that a more turgid potato chip will have a larger reading than a less turgid potato chip. This was proved correct from the preliminary work.