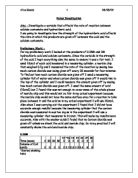
Diagram 4
This diagram shows that if you introduce a catalyst, all the reacting molecules will stick to it and so the molecules have more chance of colliding with each other when they get stuck to it.
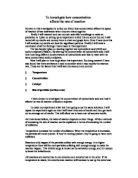
Pressure: Pressure affects the rate of reaction especially when you look at gases. If you increase the pressure in the solution, the reacting molecules have less space to move around in, which increases the rate of reaction. If you decrease the pressure in a solution, the reacting molecules have more space to move around, which decreases the rate of reaction. (See diagram 5)
Diagram 5
This diagram shows that if you increase the pressure in a system there is more chance of the molecules colliding and reacting with each other.
Chemical Equation
The chemical equation for the experiment I am about to start is (reference 1):
The symbol equation for this experiment is:
The reason why the solution becomes cloudy is because when the reactants are mixed together one of the products is Sulphur, which appears in the form of extremely small particles that are suspended in the solution.
Experimental Plan:
All of the following factors could change the rate of reaction of my experiment.
- Concentration
- Temperature
- Surface Area
I will use concentration as the variable for my experiment because:
- Changing the concentration of one or more chemicals would be more accurate than heating up a solution to predetermined temperature and keeping the solution at that temperature throughout the reaction.
- If I didn’t finish all my work in one lesson I could come back in the next lesson without having any affect on my experiment.
The reasons why I am not going to try any of the other variables are: -
Temperature: I would find that my results would be inaccurate. Because I could not make sure that the solution could stay at the same temperature for the amount of time needed. Also the solution would start to evaporate.
Surface area: If I choose to do this experiment it would be same as the concentration experiment. All of my substances are liquids and the only way to increase the surface area of a liquid would be to increase the quantity of the liquid, which is what I have to do for the concentration experiment.
Pressure: If I choose pressure as the variable I wouldn’t be able to do the experiment because I do not have access to the proper equipment and you cannot easily pressurise a liquid.
Catalyst: If I choose a catalyst as the variable I may have inaccurate results, because catalysts are hard to control and there is not a known catalyst for this experiment.
Method
For my experiment I am going to gather the following equipment: -
- 1 small conical flask
- 3 beakers
- Stopwatch
- Sodium Thiosulphate
- Hydrochloric acid
- Water
- Piece of Paper with an X on it.
I will arrange them like this: -
To carry out my experiment I will fill each of the 3 beakers with a measured amount of the following liquids from separate containers:
- Hydrochloric acid
- Sodium Thiosulphate
- Water
I will then pour each liquid into the conical flask and mix them together. Under the conical flask there will be a sheet of paper with an X on it I will then time how long it takes before the solution turns cloudy to such an extent that I cannot see the X at all.
After thoroughly cleaning the conical flask I will carry on in this manner but every time I will reduce the Sodium Thiosulphate by 5cm3 and increase the amount of Water by 5 cm3, the only liquid that will never be decreased or increased is Hydrochloric Acid this will always be 10cm3.
I will put my results in a table like this:
Table 1 - Showing how long it takes for the X to disappear as the concentration of the solution is diluted with water.
To make sure that my experiment is a fair test so the results are precise, I will:
- Take three readings for each reaction
- I will also take an average for each reaction
- I will keep each reactant in different beakers to avoid contamination.
- Clean or use a different conical flask each time to avoid contamination.
If I keep to these guidelines I should have accurate results and have completed a fair test.
To ensure a high level of safety in my experiment I will ensure that:
- Everyone in my group will wear safety goggles during the experiment.
- All bags will be kept out of the way; I will ensure this by putting them under the desk.
- Keep the experimental work surface neat, tidy and uncluttered.
Prediction
For my experiment I predict that as the concentration of the Sodium Thiosulphate is reduced it will take longer before the solution turns cloudy. This is because when the first reaction starts there will only be Sodium Thiosulphate molecules and Hydrochloric acid molecules in the solution which means that there will be less time before the reacting molecules collide with each other and react forming the cloudy solution. But towards the end of the experiment where there will be a higher concentration of water molecules and less Sodium Thiosulphate molecules so there will be a longer amount of time before the molecules collide with each other and react.
I therefore predict that:
The rate of reaction is proportional to:
I therefore predict that the rate of reaction will increase with the concentration of Sodium Thiosulphate.
I intend to show this by plotting 1/time taken against the concentration and show that the line will be straight.
Results
I have collected the data in the way that I stated in my Method and I have entered them into the following table:
Table 2 – Showing the time taken for the solution to turn cloudy with the decreasing concentration of Sodium Thiosulphate, and the increasing quantities of water.
Analysis
From the data presented in Table 2, I have converted the quantities of Sodium Thiosulphate, Hydrochloric Acid and Water into a concentration of Sodium Thiosulphate using the formula:
I have also converted the minutes and seconds into decimal seconds. These results are shown in Table 3, and plotted in Figure 1.
Table 3 – Table to show time solution took to turn cloudy as the percentage of the Sodium Thiosulphate decreased.
Figure 1
In Table 4 I have presented the average of my readings for each percentage concentration of Sodium Thiosulphate along with their range expressed as a percentage of the average.
Table 4: Table to show average time taken for solution to turn cloudy as the percentage of Sodium Thiosulphate decreased.
Figure 2 – To show trend of how concentration affects the average rate of reaction.
I have plotted the 1 / (time taken) against the concentration of Sodium Thiosulphate and this is shown in Figure 3.
Figure 3 – To show:
To aid in the evaluation of my results I have also plotted a trend line
Evaluation
a) Comparison with Prediction
From Figures 1 and 2 you can see the time that it takes for the reaction to finish decreases with increasing concentrations of Sodium Thiosulphate. This is in agreement with my prediction:
From Figure 3 you see that because the data points follow very closely to my straight-line trend line that the rate of reaction is proportional to the concentration of Sodium Thiosulphate.
b) Anomalous Results
When I was looking over my results I discovered that I have one anomalous result.
Table 5 – Table to show anomalous result
The anomalous result is highlighted in red. There are a number of reasons why this result is this far out of line, compared with the other readings.
- I may not have washed out the beakers or conical flask properly.
- I may have measured too much of one substance or not enough of another.
- The room could have become colder at the moment I did that reaction (see Background information).
- Difficulty in measuring when the reaction was completed.
c) Sources of Inaccuracy
The major sources of inaccuracy are:
- Determining the exact moment when the reaction has finished.
- A similar error to determining exactly when the reaction has finished is determining when the reaction has started because it is impossible to mix the liquids simultaneously.
- Whether the same person or different people were determining when the reaction was completed.
- When the reactions lasts over 5 minutes, it would be hard for the person recording the reaction to watch it constantly without being distracted.
c) Improvements in Experimental Accuracy
To increase the accuracy of my results I could do one or more of the following:
- Repeating the experiment more often (5-10 Readings not just 3).
- Having more than one person determining when the reaction was completed and taking the average of their results.
- Making sure that the beakers and the conical flask were cleaned well after each experiment.
- Use a more scientific way of finding when the reaction is complete, such as: using a light source and detector to get a more accurate reading of when the experiment has ended.
d) Addition Information
If I measured the temperature of the solution when the reaction was taking place I could find out if the reaction is Exothermic or Endothermic.
All of results are based on using small quantities of reactants, if I were to repeat the experiment with larger quantities of reactants and smaller quantities. This would be useful so I could see I if I got similar results and if the formula works on larger/smaller quantities.
Conclusion
From my results I have proven the collision theory to be correct.
“For two substances to react, their particles must collide together. Every time such a collision occurs there is the chance of a chemical reaction. Anything that increases the number of collisions taking place will increase the rate of reaction”(Reference 1)
This is shown in all my Tables and Graphs when the percentage of the Sodium Thiosulphate is 75% the rate of the reaction is smallest but when the percentage of the Sodium Thiosulphate is at its lowest, 12.5% the rate of the reaction is largest.
This is because:
“The more of a substance there is in a solution the a higher the chance that molecules will collide and speed up the rate of the reaction. If there is less of a substance there will be fewer collisions and the reaction will happen at a slower speed.” (Quoted from my prediction)
References
Reference 1 – Sheet handed out in class.