Number many readings needed to be able to plot a valid graph
We will be using at least 5 readings in order to get a valid graph.
The range of values needed for the independent variable
We will be using 0-1M.
How many repeats I will be doing in order to make the results reliable
I will be doing the repeats (or re-runs), and 3 of them to make the results reliable and to check for mistakes. Three repeats should seem a sufficient amount to obtain the reliable results we are looking for.
What my predictions are
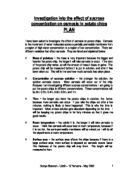
- Potatoes in distilled water (0M)will get bigger and become turgid
- Potatoes in 1M solution → smaller and flaccid
Why we are expecting this
In distilled water, water moves by osmosis from a high concentration of water to a low concentration of water by osmosis. It moves from a more dilute solution outside the potato cells to a more concentrated solution inside the cells. It is the movement of water molecules from a higher concentration of water to a lower concentration of water.
In the 1M solution water moves out of the cell by osmosis from a high concentration of water to a lower concentration of water. It moves from a more dilute solution from inside the potato cells to a more concentrated solution outside the cells.
Method used during preliminary experiments
3 chips: Distilled water, 0.5M, 1M sucrose. Measure mass and length, then leave for 40 mins. Then measure mass and length again.
Preliminary results
Explanation of how results helped in deciding the details of the method
The change in mass is very small for example for 0.5M concentration there is only a change of 0.14g this means we decided to leave it for longer than 20 minutes. Therefore in order to give sufficient time for it to react we left them in for a day.
To obtain a good range of results and those which are reliable we decided to use a range between 0 and 1M in order to obtain a good range of results for each concentration. Wed decided to use 0.0M, 0.25M, 0.5M, 0.75M, and 1.0M.
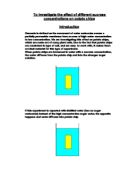
Since we were just experimenting with the prelim results, we also experimented on the size of chips. We decided that because they need to be the same length, we decided on 5cm.
We found out that this needed 12cm3 solutions to cover the chips.
We decided to measure the chips using mass rather than the length because it was a more accurate way.
Final Results
Analysis of data
From the data obtained we can say that as the sucrose level in the solution increases and the % change in mass decreases. We can see a trend that:
-At 0M there is an increase in mass of 9.15%
-At 0.5M there is a decrease in mass of 4.3% (or -4.3%)
-At 1.0M there is a further decrease in mass of 22.56% (or -22.56%)
This is due to osmosis and the movement of water. Water moves into the cells of the chips because of osmosis because there is a higher concentration of water outside the chip than inside and the water moves from a (high) to (low) concentration of water through the fully permeable cell walls of the potato and the partially permeable cell membrane. This is true for the concentrations of 0.0M and 0.25M since there is a higher concentration of water outside the potato chips in the 0.0M and 0.25M solutions than inside. From this we notice that the cells gain mass and the cells become turgid and swollen up.
For 0.5M, 0.75M and 1.0M of concentration, there is a higher concentration of water inside the cell than outside the cell. The chips in these concentrations lose water through osmosis. The water moves from a high concentration of water (more dilute solution) from inside the cells to a low concentration of water outside the cells (more concentrated solution) into the 0.5, 0.75 and 1.0M solutions through the partially permeable cell membrane and the fully permeable cell wall.
From the graph, which demonstrates the results table in a pictorial way, we can tell when and where the concentrations of the solutions affect the % change in water. From the graph we can tell that osmosis occurs with the water moving from a higher concentration of water from the solutions to a lower concentration of water inside the cells of the potato chip. This is from the 0.0M and 0.25M, but we can tell reading from the graph that up to about 0.28M the same would occur. At roughly 0.29M there would be no percentage change in mass, as it is where the line passes the y axis (% change in mass).
We can also deduce that from a concentration of 0.29M or more the potato chips lose water through osmosis, as it is shown by the negative percentage change in mass. We can say that at concentrations which are higher than 0.29M will cause water to move out from the potato chips by osmosis, and will move from a more dilute solution inside the cell to a more concentrated solution outside through a partially permeable cell membrane and fully permeable cell wall.
The results of our experiment match the prediction which was said in the plan. This was that the movement of water through osmosis and knowing the theory behind it would cause the more concentrated solutions to make the cell become flaccid, because water moves from the dilute solution inside the cell to more concentrated solution outside. For the distilled water or 0.0M concentration, water has moved from a high concentration of water.
Evaluation
Anomalous results
I did get some anomalous results, not only overall for one of the percentage changes (0.75M) and the percentage change for them was lesser than the 0.5M concentration. It appeared as an anomaly on the graph and we didn’t see a constant decreasing % change. This was most probably because chip number 2 in the 0.75M concentration had gained mass higher than the original mass itself, therefore must have driven the average up for the % change since we were calculating average % change in mass.
Reasons for the anomalies
Possible reasons for the anomalous results could be:
- The chips not cut accurately, due to lack of precise equipment. In other words, since we could only measure the potato chips accurately to the closest mm.
- Also some of the chips weren’t perfectly straight and in fact bent, causing inaccuracies in length measurements again.
- The age of chips might all be different, therefore different water contents.
- Also the blotting process wasn’t done at even lengths of time, or did not follow any set pattern.
- Some of the chips floated and some didn’t, also the chips used were all mixed potatoes (chips from the same potato weren’t used)
- Also in some of the chips not all the skin was removed.
Accuracy
The accuracy of the experiment was affected by the following:
- Timing- The chips weren’t put it in or taken out for the exact length of time
- The blotting wasn’t standardised.
- Also the temperature shouldn’t have been a factor because it was left in room temperature which would have had little variations.
Therefore although the potato chips couldn’t be controlled to a high degree of accuracy, overall we can say a fair experiment was done, and the inaccuracies were most probably the result of us not having the ability to have enough precise equipment to perform the experiment as well as it could have been performed.
Improvements
There are a number of improvements that could be made by us in order to improve this experiment, and some of these are as follows:
-
The fact that we only did 5 concentrations, and plotted a graph with the line of best fit for them means; it’s only a rough estimate of what the % change in mass is, for different concentrations, for example, say 0.6M which is in between 0.5M and 0.75M. The line is drawn as a best fit line and only gives us an estimate value of the concentrations in between. This would suggest that we do more experiments i.e. more concentrations, perhaps every 0.1M. This would narrow down the intervals of the concentrations more, meaning we can get an even more accurate reading from a graph of the % change in mass for different concentrations of solution. This would allow us to find out the % mass change of a lot more concentrations, even those which we didn’t measure, i.e. we could obtain an estimated % mass change of concentrations in between the intervals. For example to obtain the % mass change at 0.15M, we would just use the graph and the best fit line, even though we only measured concentrations going up in 0.1M.
- Also where the line of best fit crosses the x axis or in other words where the % change in mass is ‘0’ is not a very accurate interpretation of when the concentration is the same both in and outside the potato chip. This is again because of the fact that the line is only an estimate, and where it crosses the x axis is just rough idea of what the equilibrium concentration could be. Again we could do more concentrations, to resolve this problem and get more accurate data. This is again because, more concentrations would mean narrowing the concentration intervals down, and a more accurate plot of results on the graph. This would more likely give us a more accurate interpretation of where the concentration inside and outside the potato is equal, i.e. no change.
- We might possibly re-do the experiment and try using salt solutions instead of sucrose solutions, and investigate with the effects of changing the concentration of salt solutions.
-
Also we could possible cut the potato chips to a higher degree of accuracy, and not with say 30cm rulers which only gave us measurements to the nearest millimetre. They weren’t alike (chips) and some had bits of skin still on them. Therefore we could do the experiment again with more chips of even quality. This variation in the chips meant that some could float in the water and some didn’t. This has meant inaccurate results, and so to improve it, we would cut the chips using more accurate cutting tools, perhaps by using callipers.
- Also since some chips were bent (not straight) which may have caused inaccuracies in the length measurement, to solve this we could possibly use set squares for each chip and force it to be straightened, and then measure the length.
- Since the blotting wasn’t standardised, we could possibly time how long each chip is blotted in the paper towel for. This would give more accurate results, since the blotting is standardised, causing less errors when weighing the potato chip due to excess mass of the solutions outside the potato chip.
- Using chips from the same potato would also be more sensible since in my experiment some chips floated and some didn’t, this is because each potato may have had different amounts of liquid content inside them, and some potatoes may have been grown at different times. The same potato would give a more even amount of water content in each chip, which would give more accurate results. The peeling of the potato should be regular too, so the exposed surface of the chips is regular, and any osmosis occurring isn’t affected by the skin.
- Finally a lot more repeats could be done as opposed to just 2 repeats. This would obtain a lot more data for each and every concentration, and allow for a more accurate average mass change, since a larger group of mass changes is being averaged. Although this would be very time consuming, it would however enable us to check for any mistakes made as opposed to if we just did 2 repeats.
Confidence in data
Since we used 5 concentrations and did 3 runs for each one I would say that we had enough data to say whether it was a good experiment or bad one. Overall I would say it was pretty successful and it followed my prediction, apart from one anomalous result which didn’t follow the general trend.
Could our results enable us to work out the concentration of water inside the potato chip?
Yes, from the graph we can say that the point at which the line crosses the X axis. However this is just relying on where assumed and the actual results. We could not say for certain very accurately whether we would be able to or not.
Further possibilities
Some further possibilities could include for example:
- I could do more concentrations within our range.
- Also I could use salt solution instead of sugar solutions
- We could try investigating on different sized potato chips
- We could try measuring length of the potatoes and time too, instead of just leaving for a day.
- We could try using higher concentrations, and so we get different graphs
Acknowledgements
The images used for the apparatus were obtained by searching on google images (=).
The image of the balance was obtained from ‘crocodile clips chemistry.’
Finally the other pictures (picture of two beakers, and the picture of test tube) were made by me using Microsoft paint.