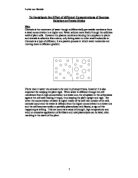
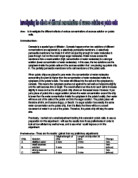
When plant cells are in a concentrated sugar solution they lose water-using osmosis, they become the opposite of turgid, ‘flaccid’ the contents of the potato cells shrinks and come away from the cell wall.
Diagram of osmosis;
Prediction:-
I predict that the higher the concentration the solution is the most osmosis will occur here as more water will move out of the potato to balance, meaning that the potato piece will shrink, I think that the middle solution with the potato will do nothing as there is equal amounts of both sucrose and water, and I feel that the lower the sucrose solution will make the potato piece swell, become ‘turgid’ in order to balance.
Variables
The only variables in this experiment are going to be the concentrations to test the osmosis activity, everything else should be kept the same, i.e. the sizes and weights of the potato parts.
Precautions:-
The precautions that have to be considered is the fairness of the test i.e. making sure all the sizes are all the same if not this could be dangerous, to make sure my hands are dry, clean, if the substances that may be on my hands could get onto the potato pieces and change the results and effect the way the osmosis occurs.
Apparatus:-
The apparatus used were:
- Apple Corer – to cut the pieces of potato
- Potatoes – may need 2, need them to show the process of osmosis
- 6 test tubes – to put the pieces of potato and solution in
- Sucrose & water solutions – to put potatoes in, need 7 different concentrations.
- Test tube holders – to hold the test tubes whilst the process takes place
- Pen, ruler and paper or a book – to record results
- Weighing scales – to weigh the potato pieces, could use electronic ones for a more accurate reading.
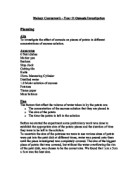
Planned method:
An assortment of concentrated sucrose and water solutions, in selected ratios, i.e.:-
Sucrose => 30ml | 25ml | 20ml | 15ml | 10ml | 5ml | 0ml
---------------------------------------------------------------
Water => 0ml | 5ml | 10ml | 15ml | 20ml | 25ml | 30ml
A B C D E F G
- Prepare these solutions out in seven different test tubes making sure that they are all in order i.e. A, B, C, D, E, F, G, and they all are the same volume. These seven solutions were chosen to show more of an example how much osmosis occurs between different concentrations.
- Do this using a measuring cylinder for more accuracy.
- Get 2-3 reasonably sized potatoes, and an apple corer.
- Cut out seven pieces of potato using the apple corer and place them in a horizontal line.
- Cut each potato piece, so they are all the same length, around 2-3cm.
- Make sure the potato pieces are in the same order as the solutions which are going to be used, i.e. potato piece one goes with solution A etc…
- One by one weigh each piece, still keeping sure that they don’t get mixed up, this process can be done using Weighing scales, or for better accuracy in weight electronic scales can be used.
- Draw a table to record the results.
The table could look like this:-
- Once all the measurements and weights have been taken on each potato piece. Then take a recording of the time and place all seven pieces of potato in its corresponding test-tube.
-
Now, leave the Osmosis to take place for around 15-20 minutes, we leave the experiment for 15-20 minutes because, 1. It gives more chance for osmosis to happen, 2.Better and more accurate results can be produced.
- To gain an average do this test a couple of times.
Fair Testing:
The experiment was kept fair by ensuring that all Potato pieces got the same time in the solutions, i.e. approx 20 minutes, they were then cleaned using a paper towel so that any sucrose solution would change or interfere with the weight results. Each time the experiment was done the things that were kept the same were;-
- Volume of solution used in each test (30ml)
- Time during the experiment (20 minutes)
- Sizes of each potato piece (Length & Width)
Safety:
Safety was not so as important in this experiment as it would be with other i.e. using acid etc. as we were only using a sucrose solution “sugar solution”, the only danger factor with this was that if it was spilt it is quite a slippery substance, so it would need to be cleaned up immediately.
Diagram:
Results:
Accuracy and Range of Readings:
To make this experiment as accurate as possible we needed to make sure that the lengths of the potato pieces and the solutions were the same volume every time, so we checked that the volumes were 30ml, and sizes were around 2cm, Also we tried to keep the pieces in the solutions for at least 20 mins to get a good reading. Two sets of results will be obtained for an average to be calculated.
Results table;
Analysis:
From my investigation I have found out that using my results and in the graphs that were made from the results, the graph for Average length change overall there is an increase in length but when looking further into the size for the before and after graph, I noticed that there are some anomalies within this such as in concentration numbers 2 and 5 as the decreased in size which was not expected, the perfect results for this graph would be for the line for the size after to have an increase whilst going down in concentration, overall the average length graph is quite accurate, the start, middle and end results turned out as expected which was good.
To improve on this, the anomalous points could be done again to see if the results still turned out the way they did before, or different, I would think they would come out different when looking over my hypothesis and research.
The results and graph produced for the change in weight were not as expected when the experiment in this experiment, I got some strange results ones which were not very accurate, the only accurate ones were the middle (concentration #G) as it was researched and predicted to turn out that way. I feel that the lowest concentration was not right, or it did not agree with my prediction as I thought that as it would become turgid it would get heavier, this could be done again to see if it is right, in this weight graph there are a couple of anomalous points such as concentration #C, it should not have lost so much weight according to my research (see preliminary work). As I said previously to improve on this I think that the test could be done again for the weight to see if the results occur to be the same
EVALUATION:
I feel that the overall procedure went according to plan, using the method made in the preliminary work, which we further used in the experiment worked well, we got all the main points needed to do the experiment and most of the results agreed with my hypothesis. If a trend line were to be added to the average size change graph it would be a straight diagonal line which is what should happen. Out of the graphs produced the length one was the most accurate with it showing with it showing that the potato does get smaller and become flaccid, and the opposite way round, i.e. becoming turgid in different concentrations. This was a good experiment to do, most results were accurate and it showed in presenting them. The reason some of my results were not anomalous was because that as osmosis occurs, water and sugar cross the cell membrane to level out, so the ones with no sucrose solution present became more turgid because there were no sucrose to replace some of the water, more water moved into the potato.
To carry this experiment on further, the tests could be done more times to see if the results are the same, leave the potato pieces in for a longer period of time too see if this get better results, possibly use a higher concentration of sucrose or use larger potato pieces