Apparatus:
I will use a metre ruler, squash ball, a beaker, ice, water, Bunsen burner, mat, gauze, tripod, tongs, safety goggles, thermometer, and a retort stand.
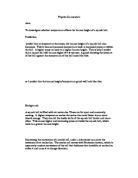
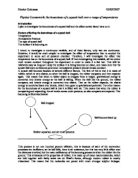
Diagram:
Method:
- I will set up my apparatus appropriately as in the diagram above.
- I will perform a quick dry run of my experiment, recording only two results, to ensure the accuracy of my experiment and apparatus.
- I will fill a beaker with water, and then adjust the temperature to approximately 10°C using ice and a thermometer to monitor the water.
- Once the water is at the required temperature, I will place the ball into the beaker, continuing to monitor and regulate the temperature with a thermometer. I will leave the ball in the water for two minutes, maintaining the temperature using more ice when it is necessary to do so.
- After two minutes, I will remove the ball from the water and drop it next to the meter stick from a height of100cm. I will then watch and note its bounce height, and repeat the drop twice.
- I will then repeat the experiment at approximate temperatures of 20°C, 30°C, 40°C, 50°C, 60°C and 70°C, using ice to cool water to temperatures below room temperature and a Bunsen burner to heat water to temperatures above room temperature. It will be too difficult to achieve exact temperatures, so approximates will have to suffice.
Results
How I Ensured Accuracy
During the experiment, all measurements were taken from the same place over a short period of time. This ensured that no discrepancies occurred with differences in the surface of the table or the temperature of the room. The same squash ball was used throughout the experiment and dropped from exactly the same height, measured by a meter ruler. The temperature in which the squash ball was submerged was measured frequently using a thermometer, and the ball was submerged in water of the correct temperature for two minutes to ensure it was the temperature required. The temperature of the ball was measured after the experiment and the two repeats, and the start and end readings used to find an average, which takes into account the cooling that took place between readings. The repeat results took place immediately after the original reading – this made sure that conditions that may have affected the reading were the same for the repeats. Taking two repeats allowed an accurate average to be found, and any discrepancies in the results can be seen easily. The metre ruler used was fixed in position with a boss and clamp and was not moved throughout the entire experiment to ensure maximum accuracy. All the equipment used was clean and properly checked to make sure it was set up properly.
Conclusion
As the graph shows, the bounce height of the squash ball increased as the temperature of the ball increased. This happened in a linear fashion, with the bounce height increasing at a relatively regular rate. As I predicted, the bounce height against temperature graph was similar to the pressure against temperature graph, highlighting the clear connection between pressure and bounce height.
As I showed in my background information, a squash ball is filled with air molecules that move around and bounce off the inside of the ball. An increased pressure placed on the molecules causes them to move faster and bump against the sides harder and more often, which leads to a higher bounce height. As the temperature of the ball increases, the pressure inside the ball also increases. So a higher temperature leads to a greater pressure, which in turn leads to a greater bounce height.
My results reflect this. At an average temperature of 7°, the average bounce height of the ball was 2.9cm. However, at 40° the average bounce height rose to 30cm, and at 79° the average height was 58.3cm. This is due to the effects of temperature on pressure, and of pressure on the speed and force of the air molecules. My results prove that a higher temperature of water causes increased pressure in the ball.
The results of my experiment show that my prediction, based on the background information I found, was correct. However, the predicted appearance of results on the graph differs from my actual results. This is probably because pressure
Evaluation
I think I performed a fair experiment, which achieved reliable results. This is proved by my graph, which shows results quite close to the line of best fit. The results I achieved are also quite close to the averages I found, which proves accuracy. I also do not have any outstanding odd results, which the nature of my experiment would make easy to identify.
However, it was difficult to keep some conditions constant, such as the temperature of the squash ball. It was impossible to achieve accurate temperatures at a fixed distance apart and so temperatures were only as close to 20 degrees apart as it was possible to get them. Taking two repeats allowed an accurate average measurement to be found, and also allowed odd results to be noticed, but, between the first and third reading for each temperature, the ball inevitably cooled, which made the readings less accurate because of the differing temperature. For example, the first reading for an average temperature of 29.5 degrees, the bounce height was 22.5cm. The third reading, however, was 20.4 cm; a difference of 2.1cm, which is probably due to the cooling of the ball between readings. The difficulty of maintaining a constant temperature could have been rectified by returning the ball to the water for another 2 minutes in order to return it to the correct temperature. This in itself may have lessened the validity of the experiment, by allowing time for other factors in the experiment – such as background room temperature – to alter.
My experiment was quite simple, which made accuracy quite difficult to achieve. The difficulty in reading accurate heights from a metre ruler as the ball bounces makes my results far less accurate than if a better measuring device had been used, such as the use of a motion sensor.