Knowing that osmosis will occur across a semi-permeable membrane whenever there is a difference between the water concentrations on the two sides of the membrane, and knowing that when this happens to cells they will either become turgid if water flows into them, or plasmolysed if water flows out of them, and thus change their volume, we want to test the hypothesis that:
If the concentration of a solution into which a cylinder of potato is placed is greater than a certain level the cylinder will contract, and if the concentration is less than that level it will expand. This can be seen in living cells. The cell membrane in cells is semi-permeable and the vacuole contains a sugar/salt solution. So when a cell is placed in distilled water (high water concentration) water will move across the semi-permeable membrane into the cell (lower water concentration) by osmosis, making the cell swell. This cell is now referred to as turgid. If done with potato cells the cells would increase in length volume and mass because of the extra water. If these potato cells were placed in a solution with a low water concentration, then the opposite would happen. Water would move out of the cell into the solution. In extreme cases the cell membrane breaks away from the cell wall and the cell is referred to as plasmolysed. The potato cells will have decreased in length, volume and mass.
The greater the concentration of water in the external solution the greater the amount of water that enters the cell by osmosis. The smaller the concentration of water in the external solution the greater the amount of water that leaves the cell.
However, there will be a point where the concentrations of water inside and outside the potato cells are equal (isotonic). At this point there will be no change in the length, volume and mass of the potato, as the net movement of water will be zero, no osmosis has occurred.
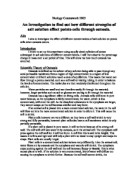
Using this information a graph and prediction can be made:
At point A the graph suggests that no osmosis has occurred, suggesting that the concentration of water inside the cell is equal to the solution outside.
At point B (high water concentration), there is no indication that the cell is increasing further in size. This is because the cell is fully turgid and no more water can enter.
At point C (low water concentrations), there is no indication that the cell is decreasing further in size. This is because the cell is fully plasmolysed and no more water can leave the cell
Fair test:
In this experiment there should only be two changing variables: 1: Different molarities of sugar solution. 2: Changing weight of the potato samples. To keep these two variables the only variables in the experiment I must:
1: Keep the potato samples the same length (2cm). This is because if one potato sample is 1cm long and one is 3cm long then the 3cm long sample will have a larger surface area and will osmosise much more quickly.
2: Use the same potato. This is because many factors due to the potato may affect the experiment. For example the age, species e.g. King Edward, size and any imperfections in the potato can be kept to a minimum.
3: Stop the evaporation of any of the molar solution. This is because if the sugar solution evaporates past the level of the of the potato then the potato sample will have less surface area in the solution so may osmosise slower. To stop any solution evaporating a foil lid can be placed on top of the test tube.
4: Accurate amount of sugar solution: More Bathing solution may affect the rate of solution. To make the amount of solution placed in the test tube as accurate as possible a syringe will be used to measure out the exact amount needed.
5: Contamination: As each test tube is filled up with the different molar solutions the syringe which would measure the amount of solution placed in the test tube may become contaminated with different molarities. To stop this the beaker and syringe must be washed every time they are used.
6: Average: To make the experiment as accurate as possible an average will be taken out of 5 results taken. Also any clearly anomalous results will be ignored.
7:Temperature: The temperature may affect the reliability of the experiment for example at extreme temperatures the cells of the potato may die and at less extreme temperatures the experiment may be speeded up. To keep this from happening all the test tubes will be kept in the same place
Hypothesis
Osmosis is the passage of water molecules from a weaker solution into a stronger solution, through a partially permeable membrane. In this case, the tiny holes in the membrane of the potatoes will allow the water molecules to pass through in and out of the solution and the potato, depending on the concentration gradient of the two substances. So in this case, when the water concentration is lower in the tissue, the water will go inside the tissue of the potato, and the potato will gain weight. And if there is very little different in the two water concentrations, there shouldn´t be such a big change in weight. And if there is a higher concentration of water in the potato, the water will go out of the potato.
The potato, cut up into pieces, will need some sort of element to survive, and in this experiment, it would be light and water. With both of these sources, the potato will keep on working, until it dies of either lack of water, too much water. When the concentration gradient is lower in the potato, the water will transfer from the solution to the potato. And vice versa.
In the distilled water, I believe that the water is more concentrated in the potato, and therefore the water should transfer from the water to the potato, making the potato bigger in size, and heavier in weight. The potato tissues, being surrounded by a weak solution, will be most likely to swell up and become turgid, taking in all the water it can possibly take in.
With the potato in molar solutions of sucrose, I don´t think there will be much change in the weight of the potato. This is because there isn´t much difference between the two substances. I believe that the weight and the size of the potato won´t be altered much.
The 0.4 molar solutions of sucrose, similar to the 0.2 molar solution of sucrose, compared to the potato, both substances have very close concentration gradients. And that is why I am predicting that the weight of the potato in this experiment should be decreased by only a fraction.
The 0.6 molar solution of sucrose, I think, should make a big difference now, noting that it should be a large difference between the two concentration gradients. And there fore the weight should decrease, at least noticeable for us to notice.
The difference between the water concentration in the potato and the 0.8 molar solution of sucrose is big, and the water in the potato should be transferred from the potato, through the permeable membrane, to the solution surrounding the potato. And as a result, I am sure that the weight of the potato will increase largely. And because the potato tissues are surrounded by a stronger solution, it will probably become smaller, and shrink. But because of such high molars of sucrose, the water can diffuse all the way, throughout the two substances, equalling the concentration gradient of the two substances.
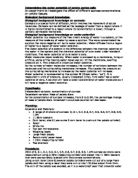
My theory in this experiment is that, due to the difference in the water concentrations of the two substances, I believe that the weight of the potato will start decreasing when it is tested on 0.2 molar solutions of sucrose and greater. By researching information about osmosis, and making predictions of the results, I believe the graph would look something like this:
Apparatus I will need:
· Cork Borer (diameter of 0.5cm),
· Water,
· forceps,
· Timer,
· Measuring cylinder,
· Tile,
· Potato,
· 0.1m, 0.2m, 0.3m, 0.5m, 1 molar of sugar solutions,
· Boat,
· Weighing balance,
· Stirring rod,
· Test tubes,
· Test tubes rack,
· Paper towels,
· Sticky labels,
· Ruler,
Diagram:
I have drawn a diagram of what the experiment will look like seen below. I have chosen the best equipment given to me to carry out this investigation thoroughly.
Fair Testing:
In this experiment on osmosis there should only be two changing variables:
1: Different molarities of sugar solution,
2: Change in mass of the potato samples.
To keep these two variables the only variables in the experiment I must:
1: Keep the potato samples the same length (5cm). This is because if one potato sample is 1cm long and one is 3cm long then the 3cm long sample will have a larger surface area and will osmosis much more quickly.
2: Use the same potato. This is because many factors due to the potato may affect the experiment. For example the age and sizes might be different, which means one potato might have more water in them then another.
3: Stop the evaporation of any of the molar solution. This is because if the sugar solution evaporates past the level of the potato, then the potato sample will have less surface area in the solution so this would make osmosis happen much slower. To stop any solution evaporating a cork lid can be placed on top of the test tube.
4: Accurate amount of sugar solution: More Bathing solution may affect the rate of solution. To make the amount of solution placed in the test tube as accurate as possible a syringe will be used to measure out the exact amount needed.
5: Contamination: As each test tube is filled up with the different molar solutions the syringe which would measure the amount of solution placed in the test tube may become contaminated with different molarities. To stop his from happening, the beaker and syringe must be washed every time they are used.
6: Average: To make the experiment as accurate as possible an average will be taken out of the 6 sets of results taken. Also any clearly anomalous results will be ignored.
7:Temperature: The temperature may affect the reliability of the experiment for example at extreme temperatures the cells of the potato may die and at less extreme temperatures the experiment may be speeded up. To keep this from happening, all the test tubes will be kept in the same place and at the same time of the one-hour experiment.
Safety procedures:
Safety is an important aspect in every experiment, even if the experiment seems to be very harmless. This is why I'll be taking this into consideration.
I will be using a very sharp knife, which could injure someone if it's not handled properly. I will also be very careful that the solutions don't get into our bodies internally, just in case, because we are not fully aware of the damage it could do to us. I will also be wearing an apron due to any solutions getting to my clothes.
But other than that, there weren't any bigger matters to be cautious of.
Method:
I plan to carry out this experiment by using all the safety issues and fair testing procedures to give me the most reliable and most accurate set of results.
I plan to have a range of sugar solutions prepared with concentrations from 0.1M to 1.0M, in intervals of 0.1, (but I will only be taking 6 of these 10 molarities, as this should be more than enough to explain the effects of the potato on osmosis). Then sections of potato will be cut using a cork borer and knife to equal lengths (5cm) keeping the surface area constant. I will then measure each tissue of potato using a measuring scale, measured in grams, when I do this I will place the boat on the scale and resetting the scale so that I only get the weight of the potato and not with the boat. I will then add 20ml of each concentration of sugar in two test tubes, giving me a total of 12 test tubes, and labelling each molar reading. Then to each test tube a cut piece of potato will be added and its concentration added to the label. These will be left for 1 hour. Then the potato pieces will be removed from the test tubes, and surface solution on the potato will be removed using paper towels. I will then measure the potatoes again, recording its change in mass by weighing them. I will then be taking the two readings of each molar concentration. This is because I will be doing a repetition of the experiment, as it will save me valuable time. These results will be taken for each concentration in order to get an average and reduce the effect of anomalous resulting.
As it is difficult to get the cut potato pieces to the same mass it was decided that I will use a percentage change in mass which will be used to compare the data in the results, as this would be far more accurate. I will do this by taking the difference in mass, divide it by the mass before of he potato and multiplying it by 100.
After looking at my preliminary work it suggested that there wasn't enough concentrations of sugar to compare each result to each other, so their will be 8 different sugar concentrations to choose from for the actual experiment. The timing of the potatoes weren't left for enough time in the preliminary experiment, as the results didn't have much change, therefore I will leave them for an hour instead of half an hour to give a greater mass change. I will also be and measuring the mass change as a percentage as it will be more appropriate so that reasonable results could be obtained.
I will also be using the same raw data table I used in my preliminary results seen below:
Solution Mass Before Mass After Length Before Length After Change Percentage In Grams In Grams In CM In CM In Mass (g) Change Of Mass
0.1m
1m
Water
Results
Results of first experiment:
Solution Mass Before Mass After Length Before Length After Change Percentage In Grams In Grams In CM In CM In Mass (g) Change Of Mass
0.1m 1.53 1.63 5 5.1 0.10g 7%
0.2m 1.49 1.55 5 4.9 0.06g 4%
0.3m 1.54 1.52 5 4.8 -0.02g -1.3%
0.5m 1.57 1.38 5 4.7 -0.19g -12%
1m 1.53 1.12 5 4.6 -0.41g -27%
Water 1.58 1.74 5 5.3 0.16g +10%
Results of repetition experiment:
Solution Mass Before Mass After Length Before Length After Change Percentage In Grams In Grams In CM In CM In Mass (g) Change Of Mass
0.1m 1.48 1.62 5 5.1 0.14g 9%
0.2m 1.51 1.60 5 5.2 0.09g 6%
0.3m 1.53 1.51 5 5 -0.02g -1.3%
0.5m 1.52 1.35 5 4.8 -0.17g -11%
1m 1.58 1.11 5 4.5 -0.47g -30%
Water 1.44 1.61 5 5.1 0.17g +11%
Average set of results from the two experiments:
Solution Mass Before Mass After Length Before Length After Change Percentage In Grams In Grams In CM In CM In Mass (g) Change Of Mass
0.1m 1.505 1.625 5 5.1 0.12g 8%
0.2m 1.50 1.575 5 5.05 0.075g 4%
0.3m 1.535 1.515 5 4.9 -0.02g -1.3%
0.5m 1.545 1.365 5 4.75 -0.18g -12%
1m 1.555 1.115 5 4.55 -0.44g -28%
Water 1.51 1.675 5 5.2 0.165g +11%
Conclusion
The evidence obtained from this investigation supports the prediction I made. It also shows that the potato cells increase mass in solutions with a high water concentration and decrease in mass in solutions with a low water concentration.
In this experiment, I believe that I have collected enough data to support my hypothesis. This investigation was, I think, successful. Successful meaning my results collaborated my predictions.
The potato cells, working to stay alive, took in, or gave out the water depending on the concentration of the tissue and the concentration of the solution it is surrounded in.
The results were fine and by looking at the weights measured before the experiment, you can see that there is no reading, which seems to be out of the line. As the weights before the experiment range between 4.62g and 4.87g, this tells us that the potato pieces were cut well, and I believe accurate enough. There were, I believe, no anomalous results after the experiment, as the weights were very similar in there own category. This tells us that my experiment was successful.
The graphs and the results show that:
· Osmosis actually took place in the experiment.
· As the molars increased, the percentage of the weight difference decreased.
There doesn't seem to be any results, which undermine my predictions, and I didn't find any anomalous results, which means I didn't have to repeat any of our experiments more than twice times.
Having the results, which backs up my hypothesis, proves that this investigation was fully accomplished, and was an achievement.
In the table seen on the last page, the percentage shows a steady decrease, telling us that the percentage of the difference decreases as the water concentration decreases.
This experiment helped me find out that osmosis occurs between 2 liquid substances with a partially impermeable membrane, and that higher the water concentration is the larger increase in grams (mass). This means that the percentage will also be higher, increasing with the grams.
Evaluation
I believe we gained accurate and sufficient enough results, shown on our graph and tables that concludes the experiment, and to prove our hypothesis. My final results were very reliable, due to the precautions I took to make this a fair test.
Looking at the overall experiment I have thought of a number of improvements to give me more and better accurate results. Firstly the concentrations were measured using a measuring cylinder and could be made more accurate using titration. Also when the potato was dried to remove surface liquid it was not necessarily done the same on each potato, a more accurate and uniform way of drying would improve the accuracy further. Another thing I could have to improve my resulting was to measure the diameter change of the potato, which would have helped me to find out the volume before and after of the potatoes, which would also help me to explain the results obtained.
To make this experiment better, I believe that I could have done one test at a time, so that I can reduce the time difference, when I have to move the potato from the test tube to the balance. Between this, I have to dry the potatoes just enough, and then put it on the balance. When I'm doing this for one set, writing down the results at the same time, while the other 5 sets are on the tissue paper, the water outside the potato tissue is going to vary for all. Therefore, I would be able to concentrate more on one of the sets, instead of trying to finish all of them as quickly as I can.
I also could have got more people to do the experiment with me, so that I can organise the tasks, and we would then be able to divide the tasks helping us to get more accurate results.
Using more types of molar sucrose solutions would have helped us obtain better results, and more accurate results, so that we can make sure the results are totally correct.
Experimenting with one set for a longer period of time, for each set, would lead us to better results, because the osmosis action would reach its maximum capability, and therefore tells us how much water could be transferred for each solution.
Further work could be carried out to include concentrations that increased in 0.05 M rather than 0.1. This would increase the accuracy and improve the graph. Other investigations could include using different varieties of potato or different plant tissues e.g. carrot, apple.
I could also extend this experiment by repeated exactly as before. However this time I could take more results at the molarity levels 0.20, 0.21, 0.22,0.23, 0.24, 0.25, 0.26, 0.27, 0.28, 0.29, 0.30. This would produce much more accurate results.
Other variables in the experiment could be changed for example instead of changing the mass of the potato the species of the potato could be changed. For example I could use a new potato and a really old potato.
Also the shape and size could be changed. However this would not affect the results much. This is because the variable would only change the rate of osmosis because of a different weight and size.
Temperature could also be changed for example the samples could be placed in different water baths and brought up to different temperatures to see if temperature played its part in the osmosis of potatoes. 5 sets of 5 potatoes could be placed in water baths at 10oC, 20oC, 30 oC, 50 oC and 60 oC. Then leave them for 24 hours making sure all the variables in the first experiment still apply however just using one molar solution. Then after 24 hours re-weigh the samples and record the result. I would expect that at high temperatures the potato samples would osmosis the most. This is because at high temperatures the solutions water molecules would move faster and therefore equal the concentration faster. A preliminary experiment could be set up beforehand to find out how long the experiment should be kept going because if the concentration of the potatoes equalises then the weight of the potatoes will be almost exactly the same.
But overall, given the apparatus that I got to carry out the test, I think this experiment turned out to be very successful, and I'm very please with my results.
Apparatus
For the experiment we will require:
"h Cylinders of potato with a diameter of 6.5mm
"h a borer with a diameter of 6.5mm
"h Sucrose solution of varying strengths (ranging from 0M to 1M)
"h A burette to measure out the sucrose solution.
"h Six jar specimen bottles
"h Razor blade
"h Callipers (To measure cylinder height.)
Method
We take a cylinder of potato from the potato, and cut it into separate cylinder. We then put three measured cylinders into six jar specimen bottles and added 20cm3 of sucrose solution into each jar (jar one was 0M-distilled water ranging to jar six-1M sucrose solution and leave for 23 hours.
We assume that this means that the pressure and temperature in each case is the same, as these are factors which could affect osmosis, and we know that the volume, size and surface area of each cylinder is the same, and as they are all from the same potato, the only variable that we are altering is the concentration of the solution.
After 23 hours we remove the cylinders from solution and, with callipers, which are more accurate than a ruler, measure the new height of the cylinders. The results, in table and graph form are recorded below in the Results section.
Results
Jar number Average length of cylinders before (cm) Average length of cylinders after (cm) % change in length
1 (0M) 2.84 2.99 15
2 (0.2M) 2.91 2.91 0
3 (0.4M) 2.90 2.75 -15
4 (0.6M) 2.93 2.61 -32
5 (0.8M) 2.88 2.47 -41
6 (1M) 2.71 2.36 -35
(SEE GRAPH)
Analysis
The results show that, in accordance with our hypothesis, the cylinders will expand when external solute concentration is low (high water concentration), and contract in strong solutions (low water concentration). This is due to osmosis, where water passes from weak solutions to strong solutions across a semi-permeable membrane, such as a cell membrane. The graphs of % change against solution strength show that the results tend to form a curve, crossing the x axis (where there is no change in length), at approximately 0.2 molar concentration.
Evaluation
In my opinion the experiment went well. I gained a good set of results and altogether I am pleased with the investigation. The graph obtained from the results has a strong resemblance to the one in the prediction. This suggests that the experiment was fairly accurate. Although 3 repetitions of each concentration are sufficient, there was a possible anomalous result (circled on graph). This part of the investigation would need to be repeated. A possible factor affecting my results is that although the cylinders were taken from the same potato there is no guaranteeing that the density remains the same throughout the potato. Another factor is that the potato from which the cylinders are taken could be abnormal - this could be prevented by amalgamating sets of results, for example of a whole class, where each experimenter used a different potato. I think that three sets of results was a good number. However, I think that in order to improve my results, the last concentration (1 moler) needs to be retaken as it is an anomalous result.
Further work could be carried out to include concentrations that increased in 0.1 M rather than 0.2M. This would increase the accuracy and improve the graph. Other investigations could include using different varieties of potato or different plant tissues e.g. carrot.
Revised Procedure.
1. Set up Test tubes, five for each molarity level, making sure they are labelled.
2. Prepare the potato samples, cut out tubes using the same cork borer and then cut them to 2cm long using a scalpel. Making sure you clean your equipment to prevent contamination.
3. Immediately weigh each sample, and then place in the bathing solution.
4. Leave for 24 hours.
5. Remove samples; wipe off excess water on dry tissue paper.
6. Immediately re-weigh the samples and record the results.
Number and Range:
There will be 7 different molarity levels 0, 0.5, 0.1.15, 0.2, 0.25, and 0.3. The results will also be taken five times per molarity level and an average taken this will help reduce anomalous results.
Appropriate Equipment.
1. 5 test tubes for each molarity level (35).
2. Bungs for test tubes (35).
3. Labels for test tubes (35).
4. Test tube rack for each molarity level (7).
5. Bungs for test tubes (35).
6. Scalpels for cutting potato samples.
7. Cork borer.
7. Cutting board.
8. Weighing machine.
9. Beakers for measuring solution.
10. Tissue for drying potato samples.
Diagram:
Procedure:
Use a syringe to measure out 50 mls of a molarity level of a sugar solution and fill up five test tubes with 50mls of the solution. This will give a range of results and if the average is taken then. Cut out five samples of potato for each molarity level all from the same potato as if the potatoes are different then their cellular make up will be to and therefore they would have different osmotic properties. Make sure that they are two cm in length. Then place them in the test tube and cover with foil so that the solution does not evaporate over the 24 hours you have to leave it. <INSERT OSMOSIS DEFINITION HERE>During this 24 hours if the potato gains wait it is osmosising and the water molecules in the solution will be able to pass through the semi-permeable membrane of the potato sample. However the sugar molecules will not be able to pass through and therefore if no sugar molecules pass through the potato will become equally balanced with the water outside and as it needs to get water into its cells to do this then it will gain wait. On the other hand if there is more of a concentration of water in the potato then the water will ex-osmosise into the sugar solution therefore losing weight. Therefore if the sugar concentration in the solution is high the water inside the potato will pass through the potatoes semi-permeable membrane and into the sugar solution.
Prediction:
The weight of the potato should not change at some point just below or above 0.25m. This was worked out using preliminary tests.
Preliminary work:
Prior to this experiment I did an experiment to help with a prediction and also to help indicate a number and range for the main experiment. The experiment was done quickly using the molarity levels 1, 0.5, 0.25 and 0. There was no average taken but it helped identify a closer range to work with. The potato sample did not gain or lose much weight at around the 0.25 mark. This meant that we could now produce a more accurate experiment at around the 0.25 molarity mark and instead of having several molarity all the way up to 1% I could be more accurate and pin point at around what position exactly I would do the experiment. This also helped establish that if the potato sunk then it would probably lose weight and if it floated then it would gain weight and therefore showed me whether it would osmosise or ex-osmosise.
Section O:
Safety: To make the experiment safe the equipment that was sharp i.e. Scalpels and core borers were used carefully and a cutting tile or board.
Table to show the average loss/gain in % of a sample of potato tissue submersed in Sugar solution for a period of 28 hours (to 2dp).
Molarity Sample Weight
Original: New: Loss/Gain (g): Loss/Gain (%): Average Loss/Gain (%):
0.0m 1 1.17 1.34 + 0.17 + 14.53 +12.66
2 1.05 1.18 + 0.13 + 12.38
3 1.11 1.25 + 0.14 + 12.61
4 1.07 1.20 + 0.13 + 12.15
5 1.03 1.15 + 0.12 + 11.65
0.05m 1 1.06 1.17 + 0.11 + 10.38 +9.70
2 1.25 1.36 + 0.11 + 8.80
3 1.13 1.24 + 0.11 + 9.73
4 1.01 1.10 + 0.09 + 8.91
5 1.22 1.35 + 0.13 + 10.66
0.10m 1 1.13 1.20 + 0.07 + 6.19 +6.97
2 1.13 1.21 + 0.08 + 7.08
3 1.11 1.20 + 0.09 + 8.11
4 1.11 1.19 + 0.08 + 7.21
5 1.12 1.19 + 0.07 + 6.25
0.15m 1 1.15 1.20 + 0.05 + 4.35 +4.40
2 1.14 1.20 + 0.06 + 5.26
3 1.01 1.05 + 0.04 + 3.96
4 1.13 1.18 + 0.05 + 4.42
5 1.00 1.04 + 0.04 + 4.00
0.20m 1 1.14 1.18 + 0.04 + 3.51 +3.26
2 1.01 1.04 + 0.03 + 2.97
3 1.03 1.06 + 0.03 + 2.91
4 1.11 1.15 + 0.04 + 3.60
5 1.20 1.24 + 0.04 + 3.33
0.25m 1 1.03 1.05 + 0.02 + 1.94 +0.40
2 1.01 1.00 - 0.01 - 0.99
3 1.01 1.00 - 0.01 - 0.99
4 1.00 1.00 +/- 0.00 +/- 0.00
5 1.02 1.04 + 0.02 + 1.96
0.30m A 1.03 0.99 - 0.04 - 3.88 -5.94
B 1.02 0.96 - 0.06 - 5.88
C 1.01 0.93 - 0.08 - 7.92
D 1.00 0.93 - 0.07 - 7.00
E 1.00 0.95 - 0.05 - 5.00
The range was close to being inaccurate but showed that the potato samples solute content was between 0.25 and 0.3.
Flow diagram of how we obtained the results:
Fill a test tube with the sugar solution
ê
Cut out potato samples with an apple corer
ê
Cut each sample to 2cm in length
ê
Place a sample inside the test tube
ê
Place a foil lid over the neck of the test tube
ê
Leave for 28 hours
ê
Remove potato sample from the test tube and wipe off excess water
ê
Re-weigh and record the results
Scatter graph to test the accuracy of the results:
Section A:
Table of results showing molarity level and % loss/gain in the potato samples weight.
Molarity Sample Weight
Original: New: Loss/Gain (g): Loss/Gain (%): Average Loss/Gain (%):
0.0m 1 1.17 1.34 + 0.17 + 14.53 +12.66
2 1.05 1.18 + 0.13 + 12.38
3 1.11 1.25 + 0.14 + 12.61
4 1.07 1.20 + 0.13 + 12.15
5 1.03 1.15 + 0.12 + 11.65
0.05m 1 1.06 1.17 + 0.11 + 10.38 +9.70
2 1.25 1.36 + 0.11 + 8.80
3 1.13 1.24 + 0.11 + 9.73
4 1.01 1.10 + 0.09 + 8.91
5 1.22 1.35 + 0.13 + 10.66
0.10m 1 1.13 1.20 + 0.07 + 6.19 +6.97
2 1.13 1.21 + 0.08 + 7.08
3 1.11 1.20 + 0.09 + 8.11
4 1.11 1.19 + 0.08 + 7.21
5 1.12 1.19 + 0.07 + 6.25
0.15m 1 1.15 1.20 + 0.05 + 4.35 +4.40
2 1.14 1.20 + 0.06 + 5.26
3 1.01 1.05 + 0.04 + 3.96
4 1.13 1.18 + 0.05 + 4.42
5 1.00 1.04 + 0.04 + 4.00
0.20m 1 1.14 1.18 + 0.04 + 3.51 +3.26
2 1.01 1.04 + 0.03 + 2.97
3 1.03 1.06 + 0.03 + 2.91
4 1.11 1.15 + 0.04 + 3.60
5 1.20 1.24 + 0.04 + 3.33
0.25m 1 1.03 1.05 + 0.02 + 1.94 +0.40
2 1.01 1.00 - 0.01 - 0.99
3 1.01 1.00 - 0.01 - 0.99
4 1.00 1.00 +/- 0.00 +/- 0.00
5 1.02 1.04 + 0.02 + 1.96
0.30m A 1.03 0.99 - 0.04 - 3.88 -5.94
B 1.02 0.96 - 0.06 - 5.88
C 1.01 0.93 - 0.08 - 7.92
D 1.00 0.93 - 0.07 - 7.00
E 1.00 0.95 - 0.05 - 5.00
The weight increased in each potato sample until just above 0.25 and below 0.30. This shows the solute content of the potato is equal with the concentration of the bathing solution. How ever the last results at 0.3 have a difference of 4%. This may produce anomalous results.
To find the exact solute content of a potato a graph will have to be plotted showing molarity against % weight change. The point at which the potato does not gain or lose any weight should be just above 0.25m. This is because there was little weight gain at 0.25 and a loss at 0.30m.
Graph of weight (%) change vs. Molarity of bathing solution (m):
Conclusion:
The graph above shows that at 0.23 there is 0% loss or gain in the weight of the potato. This shows at this point the solute content of the potato is exactly equal to the concentration of the sucrose bathing solution. Therefore no water moves between the potato and the bathing solution. This means that the weight of the potato sample does not change. So the concentration of the solute content of potatoes must be 0.23%.
Prediction:
In Section P. I predicted that the potatoes would have a solute content at around 0.25%. The real solute content of the potato was 0.23%. This proves my prediction was accurate.
Section E:
Accuracy and general comments:
The evidence obtained was accurate. Most anomalous results were cancelled out by the averages taken. The scatter graph in section A shows that the results taken were accurate and the results were all quite close to the line. This means that the results were accurate enough to make a reliable conclusion. However there were some anomalous results at some point as the table suggests that the solute content of the potato would be between 0.25 and 0.30, however the best fit line on the graph shows that this is not true and that the actual solute content of a potato is around 0.23%.
The accuracy of the experiment was accurate to suit our purpose to make it more accurate several steps could have been taken.
1: Human error: Human error could have been reduced by taken more accurate measurements to a uniform result. This could be attempted by using a tool which could be set to a set length to cut the potato.
2: Instead of the range of the potato being 0.0 to 0.30 the range could be decreased to 0.20 to 0.30. This would produce more accurate results. Also increasing the number of results so instead of taking results from 7 different molarity levels 10 molarity levels could be taken. This would make the lines of best fit on the graphs more accurate, therefore the end results would be more accurate.
3: If the potatoes did not rest against the sides then they would all have the same amount of surface area. This is the same for the potato samples that float therefore exposing themselves to air and the samples that sink stopping osmosis occurring on the areas that are touching the bottom of the test tube.
Reliability: The results were reliable to take a reasonably accurate result. However the steps above (1,2 and 3) would produce an even more accurate result.
Further work: To extend this experiment it could be repeated exactly as before. However this time results at the molarity levels 0.20, 0.21, 0.22,0.23, 0.24, 0.25, 0.26, 0.27, 0.28, 0.29, 0.30. This would produce much more accurate results.
Other variables in the experiment could be changed for example instead of changing the weight of the potato the species of the potato could be changed. For example New potatoes, King Edwards etc could be used.
Also the shape and size could be changed. However this would not affect the results much. This is because the variable would only change the rate of osmosis because of a different weight and size.
Temperature could also be changed for example the samples could be placed in different water baths and brought up to different temperatures to see if temperature played its part in the osmosis of potatoes. 5 sets of 5 potatoes could be placed in water baths at 10oC, 20oC, 30 oC, 50 oC and 60 oC. Then leave them for 24 hours making sure all the variables in the first experiment still apply however just using one molar solution. Then after 24 hours re-weigh the samples and record the result. I would expect that at high temperatures the potato samples would osmosise the most. This is because at high temperatures the solutions water molecules would move faster and therefore equal the concentration faster. A preliminary experiment could be set up beforehand to find out how long the experiment should be kept going because if the concentration of the potatoes equalises then the weight of the potatoes will be almost exactly the same.
Potato plan
We are going to investigate how soaking solutions effect on Potato cylinders. We will test the potatoes cylinders in:
We are test the variety so that we can also find the natural concentration of the potato cells.
I predict that the saltier solutions will be absorbed better, because when osmosis occurs between the solution and the cells, the highest concentration diffuses into the lower concentration. Because there is a higher concentration of salt in the 8% then the 6% solution. I also predict that at a certain percentage there will be no change in the weight, this is because there will be no higher or lower concentration. I have made a graph to show how my predictions dictate how the experiment will go.
I also predict that the colour of the lower concentration solutions will turn brown, because of oxidization. The high concentrations (4% and 8%) should show little or no colour change; this is because the salt should react in place of the potato.
Method: We will place 5 different cylinders made of potato, of the same length and width. We will at one minute intervals, place the chips into a glass beaker filled with 100mls of solution, we have chosen to use 100mls of solution so we can make sure that we have an exact percentage of salt in the solution. Every 5 minutes we will take them out, and place them on a balance. After we have recorded the weight we will immediately return them to the beaker. Other then measuring the weight every 5 minutes, at the end of the test we will note down the colour texture and length of the cylinders, we will only do this at the end because the periods out of the beaker will be to long. To insure that the experiment is reliable we will perform it twice, and discount anomalous results. To make sure that the test is fair we will make sure that the only alteration between the experiments will be the solution concentration. We will keep these constant
- Vegetable used
- Quantity of solution
- Time
- Testing method
- Equipment
Our equipment list will be:
- Potato Cylinders
- Salt solution
- Small beakers (100mls)
- Top pan balance
- Paper towels
- Stop clock
Result table