Prediction:
Potato is about 1.5 times higher in water potential than parsnip.
Explanation from knowledge:
In a hypotonic solution, the increase in length and weight of potato would not be as much as parsnip , this is because potato has a higher water potential ,that means that relatively less water will be drawn into the cells by osmosis until it is fully turgid .
In a hypertonic solution, the decrease in length and weight of parsnip would not be as much as potato ,this is because parsnip has a lower water potential ,that means that relatively less water will be drawn out of the cells by osmosis until it is fully plasmolysed .
In a certain concentration of solution, if there is no change in length and weight ,that means that the net water movement equals to zero .That means that the solute potential is equal to the water potential of the cells .Therefore we can find out the original of potato and parsnip .
Equipment:
~Electronic balance
~A ruler
~Beakers
~Tissue papers
Factors needed to be controlled:
~Temperature, best if room temperature, approx.25
~Time, best if 24 hours
~The concentration of the solution must be the same
~The samples are from the same potato or parsnip if possible
Measuring techniques:
~An electronic balance is used to weight the samples because it would give precise results and it will minimize the chances of having experimental errors when compared to a normal balance which you have to judge the reading with your eyes.
~A ruler is used because it has centimeters and millimeters reading and it should be good enough to measure the length of the samples .A consistent one is preferred because the readings printed on the surface of the ruler may vary from ruler to ruler, although not a big difference, just to minimize the experimental errors.
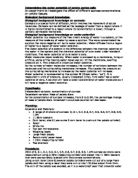
Preliminary work:
Measure the number of plasmolysed and turgid cells of the red onion cells tested in different concentration of sucrose solution.
Materials Required:
Red onion bulb epidermal strips 5ml plastic syringe Pasteur pipette
6 petri dishes 10ml plastic syringe microscope slides
6 test tubes (boiling tubes) 1M-sucrose solution coverslips
test tube rack distilled water microscope
wax pencil fine forceps sharp blade
white tile
Method:
- Label 6 petri dishes and 6 test tubes appropriately for each of the following sucrose solutions: 0.3M, 0.35M, 0.4M, 0.5M, 0.6M
- Using the 1M-sucrose solution, distilled water and plastic syringes, make up 20ml of sucrose solution of the required concentration in each test tube. The table under shows the amounts used.
- Make sure the solutions are mixed thoroughly then add to the appropriate petri dish.
- Place each epidermal strip on to the white tile and carefully trim each into roughly 5mm squares. Ensure that the piece you select contains clearly pigmented cells.
- Remove each of the 6 squares with the fine forceps and place one square into each petri dish. Make sure it is completely immersed in the sucrose solution. Leave for about 20 minutes.
- Remove the tissue from the 0.5M-solution and mount it carefully on a slide ensuring it is flat and not folded or wrinkled. Add a drop of the same sucrose solution from the petri dish to the specimen then lower a coverslip on top. Blot off any excess liquid.
- Examine under the microscope. Select a suitable area of cells using low power. Switch to medium or high power as appropriate and, moving the slide about if necessary, record the state (plasmolysed or unplasmolysed ) of the first 50 cells viewed. Cells in which there is only a slight sign of the cell membrane pulling away from the cell wall should be counted as plasmolysed.
- Repeat this procedure for the other 5 squares of epidermis, mounting them in their respective solution.
Conclusion:
From 0.0M to 0.45M, all cells are found turgid, but starting from 0.5M, there are about half of the cells observed are plasmolysed and when it is 0.6M, about 96% of the cells observed are plasmolysed. This suggests that the water potential of red onion cells is between 0.45M and 0.5M.
Reason for next test:
To see if different plants have different water potentials.
Secondary sources:
Biology 1, Cambridge University Press, endorsed by OCR.
Test for potato and parsnip
Materials required:
Potato 5ml plastic syringe
Parsnip 10ml plastic syringe
12 petri dishes 1M-sucrose solution
12 test tubes (boiling tubes) distilled water
test tube rack fine forceps
wax pencil graph paper
white tile *sharp knife
*Should be extremely careful when using it
Method:
- Label 6 petri dishes and 6 test tubes appropriately for each of the following distilled water and sucrose solutions for potato with a wax pencil :0.0M, 0.3M, 0.45, 0.5M, 0.6M, 1.0M .Label again 6 petri dishes and 6 test tubes appropriately for each of the following sucrose solutions for parsnip :0.0M, 0.3M, 0.45M, 0.5M, 0.6M, 1.0M.Put all test tubes in a test tube rack.
- Using the 1M-sucrose solution, distilled water and plastice syringe, make up 40ml of sucrose solution of the required concentrations in each test tube .For 0.0M, use distilled water.
- Make sure the solutions are mixed thoroughly then add to the appropriate petri dish.
- Peel off the skins of the raw potato and the parsnip on the white tile with sharp knife provided.
- Cut chips of raw potato and parsnip to exactly 30x5x5mm .Use strips of graph paper with squared ends to help. Need 3 chips for every solution. i.e.36 chips
- Use tissue paper to dry the surface of the potato and parsnip chips, then measure their weight and record it.
- Remove each of the 36 chips with fine forceps and place 3 chips into each petri dish. Make sure it is completely immersed in the sucrose solution. Leave it for about 4 hours.
- Remove the chips from each solution and dry them with tissue paper. Measure the length and width of the 3 chips from each solution with a ruler and electronic balance respectively and then record it. Put all the chips back into their original petri dishes after recording. Repeat the procedure after 20 hours. i.e. add up to a total of 24 hours from the start.
N.B. Recording the mass will be more accurate.
Factors that will be kept constant:
Temperature – Room temperature
Time – The time for each recording
Concentration of the solution
Controls: chips measured before immersing into any solution.
Average length: 3cm
Average weight (corr. to 2 d.p ) :
- 0.0M – 0.90g
- 0.3M – 0.89g
- 0.45M – 0.88g
- 0.5M – 1.29g
- 0.6M – 1.05g
- 1.0M – 1.10g
Discovery!!
Potato chips in a higher concentration of solution tend to be softer. This is because of the decrease in the water potential of the cells resulting to the lost of turgidity of the cells.
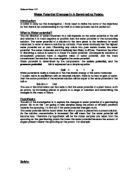
<Percentage change in mass and length of potato and parsnip in different concentrations>
*Figure rounded off to the nearest whole number
Validity of the test:
Although the concentration is only tested between 0.0M to 1.0M for both potato and parsnip, but the results obtained are significant and showed changes of the water potential of the two plants in different concentration of solution.
Graph Description:
In the graph comparing the percentage change in mass of potato and parsnip, they both decrease as the concentration increases. Potato has a constant decrease between all concentrations and a relatively small scale of decrease between every concentration, while parsnip has two steep fall between 0.0M to 0.3M and 0.5M and 0.6M.
In the graph comparing the percentage change in length of potato and parsnip, they both decrease as the concentration increases. Potato has a steep fall between 0.0M to 0.3M, while parsnip has a constant decrease between all concentrations and a relatively small scale of decrease between every concentration.
Conclusion:
The result shows that potato and parsnip has different water potentials. Potato has a higher water potential than parsnip as the percentage change in length and mass of potato both changed from positive to negative at 0.3M whilst parsnip changed from positive to negative at 0.6M. This also shows that potato’s original water potential is between 0.0M to 0.3M whilst parsnip is between 0.5M to 0.6M.
Data to support conclusion:
For more details why potato has a higher water potential than parsnip and why there are changes in mass and length in different concentration of solutions, please refer to “introduction”.
Results & Prediction:
The results also proves that the prediction of the experiment, the changes brought about by the experiment to the potato and parsnip and the reason related to the water potentials are in a right approach.
N.B. For more details please refer back to the “prediction” of the experiment
Evaluation:
All my results proceeded quite reasonably as the concentration of the solution changes and the outcome have no anomalous results or limitations.
Errors that may arise in the experiment:
~The misreading of the reading on the ruler.
~Different parts of the potato and parsnip may have difference in water potential although it is from the same potato or parsnip.
~The slight difference on the length of the chip when cut, it nay not be precisely 30x5x5mm.
~The mixing of the sucrose solution and the distilled water may not be precisely the ratio needed, maybe because of the marking on the syringe or when we read it off with our eyes.
~The time difference in putting the chips into and taking out from their solutions.
~The room temp may have slight fluctuation during the experiment.
Improvements:
~Get more helpers to put the chips in and take them out at the same time.
~Cut the chips with machine to make measurements more precise.
~Use readily prepared concentration of solutions instead of mixing the solutions yourself.
Reasons for anomalous result:
Al though I have no anomalous results, I got several ideas about why anomalous results may arise.
- The time provided is not long enough for full changes.
- Different parts of plants may have different water potentials.
- The slight difference in size of the chips may affect the results pretty much as the bigger it is, the more cells it has.
- The chips may float on the water surface during experiment, therefore affects the changes in water potential of the cells.
Reliability of results:
I think my results are quite reliable despite the fact that many errors might have affected my experiment. The reason I am confident with my results is because it does not have anomalous result, it looks reasonable. Moreover the repeated measurements are more or less the same, difference between figures I got are just a few tenths after 4 hours and the results I got after 24 hours. By the way, I have rounded off my results to the nearest whole number which may have a chance that I have affected the figures slightly.
As a result I think my conclusion is also relatively safe and it is still valid as I made my conclusion based on my results and with reference to my research, knowledge and data, despite the inevitable errors that would arise in every experiment.