time taken for a tablet to dissolve. This is how I am going to measure the rate of reaction in this particular experiment. There are many different variables that can effect the rate of reaction. A reaction can be made to go faster or slower by changing the concentration of
a reactant. A reaction can also be made to go faster or slower by changing the temperature of the reactants. In many reactions, one of the reactants is a solid. Changing the surface area of the solid can also make a reaction go faster or slower. A reaction can also be made to go faster or slower by changing the volume of water used.
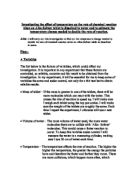
The rate of reaction depends on how many successful collisions there are in a given unit of time. A collision causes particles to react with each other. The collision must have enough energy for the particles to react together. If there are lots of successful collisions in a given period of time, then the rate of reaction is faster. In other words, the reaction goes quickly, therefore its rate is high. If there are not many, its rate is low. In a successful collision bonds are broken (this needs energy). Also new bonds are formed (this releases energy). The more successful collisions there are the faster the reaction. The variable I have chosen to investigate is temperature. When reacting substances are heated, the particles take in energy. They move faster, which means they collide more often and with more energy. So there are more successful collisions, therefore the rate goes up.
Water can be both hard and soft. Hard water contains calcium hydrogen carbonate. On heating this compound breaks down to form calcium carbonate which is insoluble. Hardness caused by calcium hydrogen carbonate is called temporary hardness, this is because it can be removed simply by boiling the water. Hardness caused by other compounds is called permanent hardness because boiling does not affect it. Therefore the results from my experiment may be unreliable at the hottest temperatures.
BIBLIOGRAPHY
- Complete chemistry (by Rose Marie Gallagher and Paul Jugram)
- Internet
HYPOTHESIS
As the temperature increases so does the rate of reaction. However at higher temperatures the pattern will break down giving unreliable results and the trend in the graph will show this. Therefore the Alka – Seltzer tablet dropped into the hottest water may give unreliable results. I think this because the water I am using is tap water, which I know contains temporary hardness. Therefore at about 60°C the tap water will start to turn to soft water, this may alter the pattern of the results making them unreliable. Also increasing the temperature of the reactants can increase the rate of chemical reactions. This is shown in the results of my preliminary work.
PREDICTION
From my scientific knowledge I know that as the temperature increases so does the rate of reaction. The Q₁₀ theory states that with every 10°C rise in temperature, the rate of reaction will double, so therefore I predict that with every 10°C rise in temperature the rate of reaction will approximately double. Therefore I have decided to increase the temperature by 10°C each time to see whether the results that I obtain support my prediction. From my preliminary work I obtained some results. I plotted those results on a graph to help with my prediction. Here is the graph:
APPARATUS
- Bunsen Burner
- 400 ml beaker
- 250 ml beaker
- Thermometer
- 100 ml measuring cylinder
- Timer
- Splint
- Tong
- Tap water
- Alka – Seltzer tablets
PLANNED METHOD
The input variable I am testing is temperature. The output variable that will change as a result of this is the time.
- A heat mat, a tripod, a gauze and a Bunsen Burner will all be taken. The Bunsen Burner (connected to the gas supply) will be placed onto the heat mat, the tripod will be placed over the Bunsen Burner and the gauze will be placed on top of the tripod. This set up will be used to heat the tap water.
- A 400ml beaker will then be taken and filled with 150ml of tap water. This will be measured using a 100ml measuring cylinder and a 50ml measuring cylinder. I decided to use a measuring cylinder because it is the most accurate source of measuring equipment available to me at school. I will use the same size beaker and the same volume of tap water for each experiment to ensure that the experiment is fair.
- A 250ml beaker will then be taken and filled with 100ml of tap water. I will measure this using a 100ml measuring cylinder. I decided to use a measuring cylinder because it is the most accurate source of measuring equipment available to me at school. I will use the same size beaker and the same volume of tap water for each experiment to ensure that the experiment is fair.
- The 250ml beaker (containing the 100ml of tap water) will then be placed into the 400ml beaker (containing the 150ml of tap water). This will be my water bath, which I will use to vary the temperature. I will use a water bath for all the temperatures to ensue that it is a fair test.
- In the 250ml beaker I decided to use 100ml for a couple of reasons. Firstly because I am using a 250ml beaker, the height of the water has to high enough for the tablet to react properly, therefore 50ml or 20ml is not a sufficient volume. Secondly if I chose 150ml then the reaction may take place too quickly, therefore the results I get may not be very accurate.
- In the 400ml beaker I am going to use 150ml so that it is enough to cover the 250 ml beaker that is going to be placed in the 400ml beaker.
- A splint will then be taken, which will be used to light the Bunsen Burner (which will be on a safety flame). The Bunsen Burner will be used to heat up the water bath.
- A thermometer will then be taken and placed into the 250ml beaker. This is done so that the temperature can be measured and later recorded.
- A timer is then obtained so that the time for the Alka – Seltzer tablet to dissolve can be recorded.
- The Bunsen Burner will then be turned onto a roaring flame to heat the water bath.
- The water bath will then be taken and placed on top of the gauze. This is done to heat the water bath.
- Once the temperature reaches 20°C, one Alka – Seltzer tablet will be dropped into the 250ml beaker, (just above the water line) and the timer is started. It will be dropped into the beaker for each experiment just above the water line, so that it is a fair experiment. This will be the first temperature that will be investigated.
- The beaker will then be taken off the gauze using a tong, (so that I do not burn my hands) but it will remain in the water bath. This is so that it maintains its temperature.
- The timer will then be stopped when the Alka – Seltzer tablet has completely dissolved and the time will be recorded and so will the temperature. I consider the point at which the tablet dissolves, is the point at which the tablet stops bubbling on the surface of the water.
- The 250ml beaker will then be taken out off the 400ml beaker and both of them will be washed thoroughly. This is to make sure they are completely clean for the next temperature, therefore making sure the experiment is fair.
- The rest of the temperatures will then be investigated using the same method as above.
- The temperatures to be investigated are 20°C, 30°C, 40°C, 50°C, 60°C, 70°C and 80°C. I have chosen these temperatures so that there will be enough results over a suitable range to plot a decent graph.
- For each temperature I have decided to do five replicates. This is so that I can ensure the highest possible amount of accuracy in the given time.
RISK ASSESSMENT
This experiment contains many possible accidents that may occur:
- I might get burnt on the Bunsen Burner
- I might get burnt on the tripod
- I might get burnt on the gauze.
- I might get burnt touching the hot beaker.
- I might spill the beaker full of hot water.
- I might break the thermometer.
- I might break the beaker.
PREDICTION
GRAPH TO SHOW HOW TEMPERATURE OF TAP WATER EFFECTS THE RATE OF REACTION OF AN ALKA – SELTZER TABLET
SKILL O – OBTAINING EVIDENCE
RESULTS TABLE
TABLE SHOWING ALL THE RESULTS COLLECTED FROM THE EXPERIMENT
METHOD UPDATE
In this experiment I have taken all the safety precautions necessary. I wore my safety goggles throughout the experiment. I also wore an apron throughout the experiment. While working with the equipment I was very careful in making sure that I did not break them or use them in the wrong way.
It is clear from my table that I have kept all the other variables constant. I did this to ensure that the experiment is a fair test. I kept the size of the beaker constant, I kept the volume of water constant and I used only one alka – seltzer tablet for every temperature.
I have recorded all the raw data from my experiment. I have also used a suitable range of temperatures and a suitable interval between the temperatures. I have also used the correct form of units and shown the replicates of each temperature in my results table.
SKILL A – ANALYSING AND CONSIDERING
EVIDENCE
GRAPH
GRAPH TO SHOW HOW TEMPERATURE OF TAP WATER EFFECTS THE RATE OF REACTION OF AN ALKA – SELTZER TABLET
(TEMPERATURE vs TIME)
GRAPH TO SHOW HOW TEMPERATURE OF TAP WATER EFFECTS THE RATE OF REACTION OF AN ALKA – SELTZER TABLET
(TEMPERATURE vs 1/TIME)
CONCLUSION
The variable I tested was temperature. From the results obtained in this experiment I have found out that the rate of reaction increases as the temperature increases, however at higher temperatures the pattern breaks down giving unreliable results. This supports my hypothesis in which I stated that,
‘As the temperature increases so does the rate of reaction. However at higher temperatures the pattern will break down giving unreliable results and the trend in the graph will show this. Therefore the Alka – Seltzer tablet dropped into the hottest water may give unreliable results.’
As you can see from the graph, at 60°C the link breaks down, giving us a result that does not fit in with the general trend of results. This is not an anomalous result and there is a reason behind this. Things tend to go wrong at higher temperatures because at higher temperatures (60°C+) the dissolved calcium hydrogen carbonate starts to decompose. This removes the temporary hardness and therefore removes the dissolved Ca2+ and Mg2+ ions, therefore making the test unfair because at lower temperatures there was hardness in the water.
From the results obtained it has been seen that the rate of reaction increases as the temperature increases, supporting my hypothesis in which I stated that
‘‘As the temperature increases, so will the rate of reaction, but at higher temperatures the pattern (link) will break down (giving us unreliable results and the trend in the graph will show this).
Therefore the Alka-Seltzer tablets dropped into the hottest water will dissolve the fastest.’’
As you can see from the graph, at 80°C the link breaks down, giving us a result that does not fit in with the general trend of results. This is not an anomalous result and there is a reason behind this. Things tend to go wrong at higher temperatures because at higher temperatures (60°C+) the dissolved calcium hydrogen carbonate starts to decompose. This removes the temporary hardness and therefore removes the dissolved Ca2+ and Mg2+ ions, therefore making the test unfair because at lower temperatures there was hardness in the water.
The graph showing the time in seconds (rate of reaction), against the temperature shows the rate of reaction increasing with the temperature, and there is a curve that at first goes down steeply, but then becomes straighter. At 80°C the link breaks down, giving us an odd result, which can be explained by the fact that the Ca2+ and Mg2+ ions are removed due to the decomposing of the calcium hydrogen carbonate. As you can see from the graph and my table of results, the result obtained at 30°C is an anomalous result (i.e. it doesn’t follow the general trend). This again supports my hypothesis in which I stated this by saying that the link would break down giving us unreliable results. The link did not break down at 60°C as I had stated that it would because that is only the temperature at which the Ca2+ and Mg2+ ions started to decompose and once they had fully decomposed the results showed this.
For the 1/time(s) against the temperature (°C) graph I got a straight line, which was the line of best fit. Again it shows how unreliable the results are at higher temperatures, as the results for 70°C and 80°C do not fit in. showing how the link breaks down due to dissolved substances in the water. This shows that the temperature is inversely proportional to the time.
Also I predicted that as the temperature increased by 10°C the rate of reaction would approximately double. The results do not clearly show this happening, but I believe that it shows some signs of this happening. At 20°C the average time is 97.5 seconds. When the temperature was increased to 30°C it approximately doubled (x 2.17 to 3 significant figures) to 45 seconds. However this is an anomalous result and should be higher. Even so, this still supports my prediction. The next result obtained is for 40°C, which is 37 seconds. There is no sign of the rate doubling (x 1.22 to 3 significant figures), but if we take into account that the previous result should have been higher, then it would appear to approximately double. From here onwards it does not double for every 10°C. This is due to my theory (scientific background knowledge) that things go wrong at higher temperatures due to the decomposing of calcium hydrogen carbonate at temperatures of 60°C and above.
Evaluation:
I have obtained a reliable set of results, with repeats of the evidence obtained. An accurate procedure was used, with this being shown by the results obtained which all agree with each other. By using a burette, it allowed me to work up to a very accurate degree of accuracy, rather than simply using a beaker or a measuring cylinder. However, I did use a measuring cylinder for repeat results and this did not seem to affect my results.
I obtained one set of anomalous results. These were obtained for a temperature of 30°C and did not fit in with the general trend. According to the best-fit line on my graph, the rate of reaction should have been longer and it should have taken about 58 seconds for the Alka-Seltzer tablets to dissolve in water with a temperature of 30°C. A reason for me obtaining this anomalous result could have been due to the fact that whilst the reaction was taking place the 100ml beaker was still in the water bath. This would have caused the temperature to rise slowly and slowly increase the rate while the tablets were dissolving, therefore causing more collisions and increasing the rate.
This did not happen however at higher temperatures, because the temperature of the water bath was about the same, and so it did not really have much effect, and it just kept the temperature constant (i.e. stopped it rising or falling).
Although I tried my best to make the experiment perfect there were some unavoidable inaccuracies with the experiment. Firstly, when testing lower temperatures, the temperature of the water bath, which was much higher than the actual temperature being tested, caused a rapid increase in the temperature, or if it were lower it would cause it to decrease rapidly, especially when taken off the Bunsen. These gave us results for inaccurate temperatures to which were we testing. To overcome this problem, a thermostatic water bath would need to have been used, since it can be set to a certain temperature, and it will stop when it reaches there. Also it would mean that the solution inside it would reach the exact temperature or close to it., and not increase or decrease once the water inside it has reached equilibration.
Secondly, it was impossible to say when exactly the Alka-Seltzer tablets had completely dissolved and consistently decide this for every result obtained. This was a huge flaw in the experiment and affected the results in a big way. To overcome this problem a special piece of apparatus would be needed to decide exactly when they had dissolved each time and give us the same measure of consistency each time.
To improve the quality of the results, the same piece of apparatus would have needed to be used throughout the whole experiment, and not changed for repeat results. To extend my inquiry and provide additional evidence for this experiment, I think that I could have investigated up to higher temperatures and see how the link would break down, and how the results would fit in with the trend of results. Also, it would have helped me to see how the decomposing of the dissolved substances affected the results. To improve the experiment and make it fair, distilled water should have been used instead of tap water because it is purer than tap water and does not contain impurities.