- Method
- How to change the independent variable
Applying force to the piston of the Syringe in order to decrease the Volume of the confined gas (Air)
- How to control Variables
- Temperature of the Confined Gas (Air) inside the syringe. (Conducting the experiment at Room Temperature)
- Mass of the Confined Gas (Air)
(Conducting the experiment in the same procedure)
- Size of the syringe and piston in which the Gas (Air) is confined (Using the same Syringe/Piston for all trials)
- Procedure
- Apparatus and Materials
- Data Logger (Pressure Sensor)
- Procedure
- Connect Pressure Sensor to Plastic Syringe
- Push the Piston until the the tip of the piston reaches the mark of the required volume
- Record Pressure from Data Logget
- Data Collection and Processing– DCP
- Data Collection
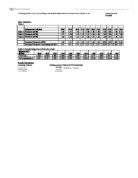
Table2.1 shows raw data recorded from the experiment.
1Volume of Confined Gas (Air)
2Pressure of Confined Gas (Air)
3Average Pressure of Confined Gas (Air)
- Data Processing
Table 2.2 shows processed data after being recorded from the experiment
Example:
Mass of trapped gas =
*D = 0.001225 g/cm3
*Volume of trapped gas (Air) in cm3
jghs.edin.sch.uk. <http://www.jghs.edin.sch.uk/departments/mathscience/chemistrynotes/highernotes/chemistryhighernotes/moles_and_energy.pdf>.
Example:
Number of Moles =
*Molar Mass of Air = 28.96 g/mole
*Mass of trapped gas (Air)
Utc.edu. < http://www.utc.edu/Faculty/Tom-Rybolt/121and122lecture/molecalculations.pdf>.
Example:
Average Pressure =
Buchanan, L., Fensom, J. Kemp, E., La Rondie, P., & Stevens, J. (2012).Mathematics Standard Level. New York: Oxford
- R – Ideal/Universal Gas Constant
Boyle’s Law states that:
Hence,
nRT = 5.1589
91.8 = 16.67 * (0.0025 * 292.85 * R)
R= 7.52 KPa.dm3.mol-1.Kelvin-1
*Temperature of syringe = 292.85 Kelvin
*Number of moles of trapped gas (Air) = 0.0025 moles
Utc.edu. < http://www.utc.edu/Faculty/Tom-Rybolt/121and122lecture/molecalculations.pdf>.
Percentage Deviation =
2.3 Data Presentation
- Volume vs. Average Pressure
Graph 2.1 shows the Volume of trapped gas (Air) in dm3 plotted against the Average pressure exerted by it in KPa.
Δm =
Graph 2.2 shows 1/Volume of trapped gas (Air) in dm-3 plotted against the Average pressure exerted by it in KPa.
- Conclusion and Evaluation
- Conclusion
In this experiment, it was deduced that when the volume of a confined gas is decreased, its pressure increases, at a constant temperature. As seen in Graph 2.1 there is a negative correlation between the volume and the pressure of the confined gas – indirectly proportional. For example, when the confined gas is at a volume of 0.055 dm3 the pressure exerted is equal to 99.9 KPa, however when the confined gas is forced to a volume of 0.035 dm3 the pressure exerted is equal to 155.1 Kpa.
The hypothesis deduced can be justified by stating that when the volume of a gas in a confined manner is decreased, the gas particles collide with each other and with the walls of its surrounding more frequently as there is less space, hence they exert more pressure.
Overall, the results of this experiment prove Robert Boyle’s Mathematical relationship regarding the Volume and Pressure of a confined gas which is:
PV = nRT
- Evaluation
In such an experiment, random errors which would increase the rate of error would include changes in the temperature of the surrounding (causing changes in the temperature of the syringe), presence of impurities or any other different gas other than air in the syringe.Such random errors might have decreased the precision of this experiment.
On the other hand, Systematic errorstransfer of heat from the hand of the pupil onto the syringe when handling it (causing fluctuations in the temperature), movement of the piston away from the desired mark at high pressures (causing changes in pressure), or leakage of air through the syringe or the data logger (causing changes in pressure). Such systematic errors will result in limited or decreased accuracy of the experiment.