Data Processing
Overview – The experiment was replicated by 5 different groups in order to allow for random errors. Therefore in order to attempt to graph the results, it was decided to average time for the iodine within the reaction to become clear. The concentration of the iodine solution each had an associated percentage uncertainty and the time also had such associated uncertainty, however in by averaging the results it was deemed that the use of standard deviation from results would be a better indicator as to the consistency of the average results.
The aim of this experiment is to consider the iodination of propanoane in the presence of sulfuric acid catalysts and hence determine the rate equation. Upon examination of the data it was determined that water does not affect the rate of reaction and as such was not regarded as a concentration to be considered within the reaction rate graphs and is therefore not included in the equation.
In order to calculate the rate of the reaction the volumes of Iodine were divided by the average time for each solution to react, to give the initial rate in m mol dm-3 sec-1. A rate against concentration graph was plotted in regards to each reactant, in order to determine the effect each substance, Sulfuric Acid, Iodine and Propanone had on the rate equation. The trend of the graph was used suggest the order of reaction for these substances along with R2 value, the x intercept and the gradient.
However in order to create a complete rate equation, the k value, or rate constant needs to be determined. This can be done by rearranging the rate equation so that:
(Concentration of Propanone x Concentration of H ions *sulfuric acid*)
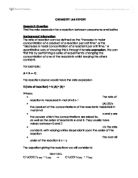
This calculation of the rate constant was completed for the rate average of each of the seven mixtures. These values were then averaged again, so that the k value would be constant within each mixture as it is proposed to be a constant value for that particular reaction. After conducting research as to the possible reaction mechanism for this reaction was determined to be that of:
Figure 1: ‘Reaction Mechanism’ Obtained the 23rd of May from by Keusch, 2003
In order to allow for a valid comparison of reaction rate and therefore rate constant between researched theoretical data and that of experimental data it was deemed necessary to convert the rate from (micro molar) m mol dm-3 sec-1 to that of merely (molar values) mol dm-3 sec-1. The associated uncertainty, including that to do with concentration, volume and time were also calculated.
Sample Calculation –
Table 8 –.
The ± uncertainty values indicated were determined by calculating half of the range, standard deviation would not be applicable as only 5 trials were conducted. Excel was used for these calculations.
Calculation of Rate: Change in Concentration / Change in Time
The assumption was made that when the time stopped the concentration of Iodine is 0, therefore the change is that of original concentration of iodine in the solution.
Concentration of 0.005 M iodine used in the solution in order to obtain the value of 1.0 m mol + 6.0 x 10⁻² in the reacting solution = 1.0 m mol dm-3 + 1%
Initial rate = 1.0+6% ≈ 2x10⁻²+57% = 2x10⁻²+ 1x10⁻² mmol dm-3 sec-1
50.13+50.13%
The 6% comes from the absolute error associated with the burette used to add each of the solutions and that of expected percentage uncertainty for the stock solutions. As percentage was used for the stock solutions the absolute error needs to also be converted.
0.1 x 100 + 1% = 6%
2.0
Rate of Reaction for solution A= 1.0 m mol dm-3 / 50.13 seconds
= 0.020 m mol dm-3 sec-1
Rate of Reaction for solution B= 1.0 m mol dm-3 / 25.56 seconds
= 0.039 m mol dm-3 sec-1
Rate of Reaction for solution C= 1.0 m mol dm-3 / 15.98 seconds
= 0.063 m mol dm-3 sec-1
Rate of Reaction for solution D= 0.50 m mol dm-3 / 30.05 seconds
= 0.033 m mol dm-3 sec-1
Rate of Reaction for solution E= 0.25 m mol dm-3 / 11.91 seconds
= 0.0204 m mol dm-3 sec-1
Rate of Reaction for solution F= 1.0 m mol dm-3 / 23.60 seconds
= 0.042 m mol dm-3 sec-1
Rate of Reaction for solution G= 1.0 m mol dm-3 /15.86 seconds
= 0.063 m mol dm-3 sec-1
Though the reaction rate for each of the solutions was calculated only those with differing concentrations but the same variables (the concentration of the other substances tested) were utilized in the graph for the sake of control said variables. As such for Iodine the solutions graphed are that of A, D and E.
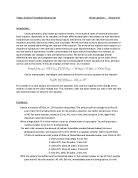
Graph 1 –
The average calculation of rate against concentration for the different concentrations of Iodine.
When examining the graph it is possible to determine that there is no apparent increase in rate with an increase in concentration. When compared with the diagrams of the different order of reaction it can be suggested that this indicates that the concentration of iodine does not affect the concentration of the reaction and thus is that of zero order.
In order to determine the complete rate expression it is necessary to repeat these calculation with the other solutions.
Calculation of Rate: Change in Concentration / Change in Time
The assumption was made that when the time stopped the concentration of Propanone is 0, therefore the change is that of original concentration of Propanone in the solution.
Rate of Reaction for solution A= 0.4 m mol dm-3 / 50.13 seconds
= 0.008 m mol dm-3 sec-1
Rate of Reaction for solution B= 0.8 m mol dm-3 / 25.56 seconds
= 0.031 m mol dm-3 sec-1
Rate of Reaction for solution C= 1.2 m mol dm-3 / 15.98 seconds
= 0.075 m mol dm-3 sec-1
Rate of Reaction for solution D= 0.4 m mol dm-3 / 30.05 seconds
= 0.013 m mol dm-3 sec-1
Rate of Reaction for solution E= 0.4 m mol dm-3 / 11.91 seconds
= 0.034 m mol dm-3 sec-1
Rate of Reaction for solution F= 0.4 m mol dm-3 / 23.60 seconds
= 0.017 m mol dm-3 sec-1
Rate of Reaction for solution G= 0.4 m mol dm-3 /15.86 seconds
= 0.025 m mol dm-3 sec-1
Though the reaction rate for each of the solutions was calculated only those with differing concentrations but the same variables (the concentration of the other substances tested) were utilized in the graph for the sake of control said variables. As such for Propanone the solutions graphed are that of A, B and C.
Graph 2 –
The average calculation of rate against concentration for the different concentrations of Propanone.
When examining the graph it is possible to determine that there is an apparent increase in rate with an increase in concentration. When compared with the diagrams of the different order of reaction it can be suggested that this indicates that the concentration of iodine does affect the concentration of the reaction and as this appears to be that of a linear relationship it can be suggested that is is a first order reaction in regards to Propanone. Though the y-intercept is not at that of zero however indicates that it may be so and due to the fact the gradient is positive indicates that there is a proportional relationship between concentration and rate. The value for R2 is almost that of one indicating that the trendline is fairly reliable in giving an idea as to the general trend of the rate against concentration. However the uncertainities attached with the reaction rate have not yet been calculated and taken into consideration.
Calculation of Rate: Change in Concentration / Change in Time
The assumption was made that when the time stopped the concentration of sulfuric acid is 0, therefore the change is that of original concentration of sulfuric acid in the solution.
Rate of Reaction for solution A= 0.2 m mol dm-3 / 50.13 seconds
= 0.004 m mol dm-3 sec-1
Rate of Reaction for solution B= 0.2 m mol dm-3 / 25.56 seconds
= 0.007 m mol dm-3 sec-1
Rate of Reaction for solution C= 1.2 m mol dm-3 / 15.98 seconds
= 0.075 m mol dm-3 sec-1
Rate of Reaction for solution D= 0.2 m mol dm-3 / 30.05 seconds
= 0.006 m mol dm-3 sec-1
Rate of Reaction for solution E= 0.2 m mol dm-3 / 11.91 seconds
= 0.017 m mol dm-3 sec-1
Rate of Reaction for solution F= 0.4 m mol dm-3 / 23.60 seconds
= 0.017 m mol dm-3 sec-1
Rate of Reaction for solution G= 0.6 m mol dm-3 /15.86 seconds
= 0.038 m mol dm-3 sec-1
Graph 3 –
The average calculation of rate against concentration for the different concentrations of Sulfuric Acid.
When examining the graph it is possible to observe that it has a similar trend to the previous graph of Propanone. Thus indicating that Sulfuric Acid has a first order of reaction as the rate appears to increase in a linear way to the concentration.
Therefore Rate = k [Iodine]X[Propanone]Y[H+]Z
=k [Iodine]0[Propanone]1[H+]1
=k [Propanone][H+]
In order to calculate the rate constant (represented by the value K) it is necessary to rearrange the equation. This will allow for the rate equation to be created and hence develop a reaction mechanism.
Rate =k [Propanone][Sulphuric Acid] this can be rearranged to k = rate/ concentrations of Propanone x sulfuric acid
For example with solution A
k =rate/ [Propanone][Sulphuric Acid]
k =2 x 10⁻² + 1 x 10⁻² m mol dm-3 sec-1 (50.13%) / [400 + 6% m mol dm-3][ 400 + 6% m mol dm-3]
k 1 x 10⁻⁷ + 62.13%
k 1 x 10⁻⁷+ 6.213e-8 m mol dm-3 sec-1
k 0.0000001 + 62.13% m mol dm-3 sec-1
However as these numbers are relatively low they are as such difficult to perform calculations with and therefore it was decided to leave in micro molar format has the value found in research iwas converted to micro molar format, and this allowed for easier calculation. Despite this, rate should technically be presented in mols per volume per second but this value is incredibly miniscule and hence hard to perform calculations with accurately, due to the increased likelihood of human error involved in calculation.
All of the values for k for each mixture were averaged on Excel using the following formula presented by a sample calculation:
m mol dm-3 sec-1
= 1 x 10⁻⁷ + 25 %
This uncertainty is calculated as being half that of the range, in order to keep consistent with the previous uncertainty calculations rather than changing to that of standard deviation.
Finally it necessary to compare this experimental value with that of the predicted theoretical value located through research. Value was located from the same site which provided the possible reaction mechanism as well as other sites in order to determine which was most relevant as it featured similar conditions.
1 mol = 103 m mol
10-3 mol = 1 m mol
Therefore the value of k as 1 x 10⁻⁷ m mol dm-3 sec-1 is equal to 1 x 10⁻¹⁰ mol dm-3 sec-1
Table 10: The k (rate constant) calculated for the different mixtures
The calculated values for k for each mixture are displayed in the table above. The uncertainty for each of these mixtures is relatively high, with the greatest being that of 0.00000000009 for that of solution D. These values were then averaged to determine the k value presented above.
(Experimental)
Theoretical x 100
= (1 x 10⁻¹⁰ )
1.09 x 10-10 x 100
= 91%
Therefore to calculate absolute:
91 % x 1 x 10-10 = 9.1 x 10⁻¹¹
100
Table 11: The average k, percentage error and percentage uncertainty
The average constant for rate is displayed within this table along with the percentage error, determined by comparing the theoretical value suggested through research with that of the obtained data from which the mechanism was obtained. This value is higher than that of the percentage uncertainty, suggesting the main cause of error is that of systematic, as although the percentage error allowed for 25% variance from the theoretical value, it was much greater being that of 91%.
Conclusion & Evaluation
Conclusion and Justification –
From the data obtained the rate constant fit however when compared to the theoretical literature value it was presented as being inaccurate. The proposed rate equation for this particular practical is found to be: R= 1 x 10⁻¹⁰ [Propanone][Sulfuric Acid]. After examining the data in the form of a rate against concentration graph it was suggested that Iodine [I2] was zero order and as such does not affect the rate equation, however the concentrations of Propanone and Sulfuric acid appeared to have a proportionally first order of reaction. This proposed equation mirrors what was suggested by the reaction mechanism found through research. This is due to the iodine, perceived as a zero order reaction is seen as that of a fast type of mechanism and therefore is not a vital rate determining step. However upon examination the neutralization of the hydroxyl group and the formation of the double bond within propanone, this reduction of Hydrogen ions is also part of the slower and hence rate determining step, which is supported by the concentration against rate graph. The rate equation and the reaction mechanism seem to be linked and support the claim that the concentrations of sulfuric acid and the propanone affect the rate equally.
In saying this, it is necessary to take into consideration the likelihood of variance due to systematic and/or random errors, which may impact either the precision and/or the accuracy of the results obtained. Thus the value for k determine must be examined critically, along with the percentage error and percentage uncertainty. Firstly as the percentage uncertainty indicates the precision of the values obtained, this value was relatively low, being equal to only ¼ of the suggested value, suggesting that the experiment in itself was fairly precise, and in comparison to the percentage error being that of 91% which indicates that the experiment is not in fact very accurate. This percentage uncertainty is probably due to the variable of time, when using a stopwatch to determine when the reaction had finished taking place. Although stopwatch itself had a low uncertainty of + 0.01, each experimental group was responsible for their own timing, thus the human reaction time of individuals conducting the experiment; this means that it is expected to have low precision. This in itself would make the experimental value for k less reliable as the variance between trials could be so great as to allow for correlations to be made when none were present. This would not only affect the k value determine but also the order of reaction, as the uncertainties could cause the trend line to be no longer reflective of a zero or first order reaction. Although the graphs created strongly support that propanone and sulfuric acid are that of first order, and iodine is zero order, the units and uncertainty attached with concentration and time could cause a significant change to the general trend and hence the conclusions drawn from the data.
It is also necessary to regard the incredibly large percentage error, calculated from the actual yield and theoretical data for the k of this reaction. The k value of 1 x 10⁻¹⁰ mol dm-3 sec-1 had a percentage error of 91%, indicating that as it was higher than that of the percentage uncertainty the main cause of error can be considered to be that of systematic error, as the way in which the experiment was carried out resulted in accurate results. This percentage error has a huge effect of the conclusions drawn from this experimental data as it indicates that the data, though it may appear relevant for this report, is not consistent with other data obtained, and the value of k proposed from these calculations can hence be regarded as inaccurate as it does not fit with the theoretical value obtained, even when taking into account the percentage uncertainty, thus indicating that the main error occurring within this experiment is that of systematic, as even if all possible random errors, determined from uncertainty where taken into consideration the k value would still be approximate 66% off the theoretical value.
If then the observations from the experiment are then taken into consideration it is possible to determine the causes for some of the systematic errors. One of these errors could be that of temperature as it would affect the rate of reaction. When conducting research it was found that one website noted the reaction constant was that of 3.7 x 10⁻⁶ when at 25°C and 4.1 x 10⁻⁶ at 5°C (Kelso High School), indicating that the temperature of the surrounding would affect the k value determine. Also as it was determined that the difference between the theoretical value and actual value were high, it can be suggested that the temperature was different to that of the theoretical value however was relatively constant throughout the experiment. Another suggested cause for this systematic error can be that of human reaction time. The research data used in this investigation featured the use of a UV-Vis Spectrometer in order to observe the colour change in a more precise and theoretically more accurate manner. It was also mention in the observations that some of the burettes were noted as leaking, thus suggesting that although the precision for the burette and concentrations is believe to be high, this may in fact not be the case and the concentrations used may be far less that what was used in the equation.
In conclusion this suggests that although the order of reaction matched with what was located from the reaction mechanism and from literature, with only propanone and hydrogen ions affected the rate, the rate constant determined from the experimental data, though believed to be correct for the same conditions as were used in the practical are not accurate or relevant when concerning the reaction in any other circumstances.
Limitations and Improvements –
Temperature of the Room
Effect on Results: The temperature of the room has the potential to affect the accuracy of the data and as the percentage error located is that of 91%, temperature could have significantly affected the rate constant. The temperature is considered to have remained relatively constant throughout the experiment and as such is likely to have affected the percentage error rather than individual results. Despite this, if it had this would have greatly reduced the reliability of the data between the differing conditions and hence have affected the rate constant.
Method of Improvement: It would be possible to monitor the temperature through means of an air conditioner and thermometer. Another way in which to do so would be to place the reactants in a water bath and then set it to the same temperature as that mentioned within the literature researched.
Human Reaction Rate to Colour Change
Effect on Results: Relying on different individuals from different groups in order to determine the time for the reaction to occur is incredibly inaccurate. It reduced the reliability as the different groups may perceive colour change different, they may have eye troubles or the test tube may be tinted, as was believed to have occurred.
Method of Improvement: Repeated trials, by the same experimenter will help to lower the number of inconsistencies. Another way to ensure more accurate acknowledgement of the colour change and therefore completion of the reaction would be to utilize a UV-Vis spectrometer in order to accurately calculate when the reaction has a similar value to that of a control set.
Human Reaction Rate to Timing
Effect on Results: This variance to when each group decided to classify the reaction as complete and therefore stop timing significantly reduced the precision of the results and each person had their own specific value. Sometimes the groups would debate as to when the colour change actually occurred and as such each experimenter’s individual standards for reaction change will affect the time noted.
Method of Improvement: Similar to that of the improvement to the perception of colour change, having only one person, with their own interpretation that remains constant will allow for greater precision with the timing, however with this being said it also may reduce the accuracy, as the individuals own perception may be hindered or biased.
Bibliography
Kelso High School. (n.d.). Investigation of the Reaction Kinetics. Retrieved May 24, 2012, from
Keusch. (2003). Kinetics. Retrieved May 22, 2012, from University of Regsenberg: