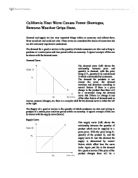
The Supply of a good or service is the quantity of which producers are able and willing to produce at a certain price and time period within an economy. A typical example of this can be shown with the supply curve (below):
Supply Curve
This supply curve (left) shows the relationship between the quantity of product which can be supplied at a given price. With the price being P1, quantity of the product Q1 and the supply curve S. Just like demand, the supply is determined by several factors which effect how the curve looks. Again just like in the demand for a good or service if the price of the product changes there will be a movement along the supply curve. But any other factors such as the costs of factors of production (costs of resources, labour, etc.), technology improvements (machinery upgrades), etc. will cause the supply curve to shift either to the left or right.
In Los Angeles, California in March 2007 there was a very worrying heat wave sweeping this part of the country, which reached over 100 degrees Fahrenheit. This caused an extremely large increase in the demand for electricity because people were using cooling appliances which require so much electricity to function such as air-conditioners. Because of the increased demand, the supply was increased to the maximum possible but with demand topping supply capabilities this left few homes without an electricity supply.
The demand for electricity has changed as shown in Fig 1.0 below:
Fig 1.0 - Demand Curve for Electricity, Los Angeles:
Here the demand for electricity has made a huge increase due to a sudden change in a factor of climate, which shifts the demand curve D to D1 and the quantity demanded to increase from Q to Q1, leaving the price P the same.
This has happened due to more air-conditioning units being used throughout the day to cool the home which increases the demand for electricity if they are running 24 hours a day compared to normal days with lower temperatures where they are not used as much.
The supply for electricity was increased to as much as it was possible for the electrical firm to output because of the technology it had in its possession. This is shown in the following Fig 1.1 supply curve below:
Fig 1.1 – Supply Curve for Electricity, Los Angeles:
The supply of electricity has been increased by the firm from Q to Q1 and has caused the supply curve to shift from S to S1. Again the price has remained the same because electricity is at a fixed price rate. This firm has increased output to meet the demand or power outages will be created.
Due to the sudden changes in climate the power companies were unable to meet the increasing demand for electricity, even though it was operating at maximum capacity. This caused a shift to the right in the quantity demanded and the quantity supplied of the two curves. There were still people without electricity due to the fact that these air-conditioners were being used to cool homes and also public cooling stations, on top of everyday appliances which require electricity too. This caused an excess demand in the economy because the power company could not supply enough electricity to meet the demand at the time of the heat wave.