Procedure
- took 6 samples of water from 6 different locations: 3 from the intertidal area, and 3 from the stream area.
- used paper filter to filter out the dirt
- measured the mass of 5 empty beakers and record the measurements
- chose one water sample first and put 5ml of it into 5 different beakers and evaporated the water completely to get white particles
- measured the mass of each beaker with the leftover compounds; used the empty dry beaker’s mass to subtract from this mass to get the salinity
- repeated step 2 – 5 with the other 5 water samples to collect more data
- used pH meter to measure each filtered sample and record the data
Data and Observations
Table 1: Salinity and pH of Six Different Water Sample
* all measurements of weight are 0.01 g/5mL
Table 2: Observation of Compounds in the Beaker after Evaporation
Discussion
Table 3: Significance of Differences in Mass
* For mean masses, refer to Table 1. For standard deviation, refer to appendix I.
From the above table, we can see that difference in average mass of salt concentration in a 5mL water sample is greater than their corresponding calculated standard deviations. Such relationship between the mean and the standard deviation demonstrates that the difference in salinity didn’t occur by chance. They are almost certainly significant to the experiment result. The water collected at the dock at the intertidal region has the highest salinity, followed by the beach at the east of the dock at the intertidal region, west beach of the intertidal area, outermost region of stream, midzone of stream and innermost area of the stream.
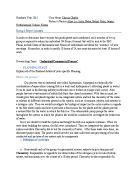
This is a graph based on data in Table 1:
There seems to be no correlation between the two sets of data because it’s very difficult to draw a best fit line. By using Spearman’s Rank correlation test (Appendix II), we discover that it is highly improbable that there’s a correlation between salinity and pH level.
Sources of Errors
A primary source of errors occurs when we tried to evaporate the water to obtain salt. When there was a little bit of water left in the beaker, some salt began to splash out of the beaker, leaving white crystals around the container. Some salt may be lost because of this. Furthermore, because our group was sharing the hot plate with others, their splashing salt might come into our beakers, resulting unintentional gain of salt. Both loss and gain of salt can result in errors in the salinity. If I were to do this experiment again, I would use a paper towel to cover my beaker during heating. After the beaker is completely dried, I would scrape some salt that’s stuck to the paper towel back into the beaker to ensure accuracy in the salinity.
Another possible error is the remnants in the beaker after evaporation. Although we tried to avoid contaminants by filtering, there can still be some chemical compounds or micro-organisms in the water. These can add up to the mass of compounds in the beaker after evaporation, which would again cause inaccuracy in salinity. If I were to do the experiment again, I’ll perhaps measure the mass of NaCl by titrating Silver Nitrate with Sodium Chlorate.
An error might also have occurred in the pH levels. Defined as H+ and OH- concentration in a sample, pH has to be measure as quickly as possible because changing environment may cause changes in these two ion concentration. In our experiment, we couldn’t measure the pH levels immediately because we weren’t allowed to take the pH meter outside the lab, so this may result in some fluctuation in the pH level. If this experiment is done again, we may use pH paper instead for immediate testing. However, pH paper can sometimes be difficult for distinguishing colors.
Conclusion
The main purpose of this experiment is to see the correlation between salinity and pH. Through statistical analysis (Spearman’s Rank correlation) of obtained data, we found that there is no correlation between the two. However, we did find that intertidal region has higher salinity than the stream area does, as confirmed by the comparison of standard deviations.
Appendix I
Calculating Standard Deviation (Formula:)
* all mass measurements have errors of 0.01 g/5mL
A. Intertidal Area
Standard deviation = = 0.050 g/5mL
B. Outermost of Stream
Standard deviation = = 0.0061 g/5mL
C. Midzone of Stream
Standard deviation = = 0.0050 g/5mL
D. Innermost of Stream
Standard deviation = = 0.0047 g/5mL
E. Dock at intertidal
Standard deviation = = 0.0075 g/5mL
F. Beach at the east of the dock at intertidal region
Standard deviation = = 0.056 g/5mL
Appendix II Statistics Analysis – Spearman’s Rank Correlation
* Using data from Table 1; all salinity 0.01 g/5mL
Table 4: Spearman’s Rank Process
d2 = 4867
To calculate the correlation coefficient (r) using formula r = 1-
r = 1 - = - 0.08 degree of freedom = number of samples – 2 = 28
The correlation coefficient fails the 5% acceptance level, which means that there’s most likely no correlation between salinity and pH levels.
Bibliography
“pH.” Wikipedia. Jun. 2008. Wikimedia Foundation, Inc. 23 June. 2008 <http://en.wikipedia.org/wiki/PH>