General form: y = ax3 + bx2 + cx +d. Using the polysimultaneous equation solver in the calculator, different combinations of variables (x, y) from table 1 were tried until the right combination that fitted the graph well was reached. The combination is:
15.70= a33 + b32 + c3 + d…………...1 (x = 3, y = 15.70)
15.30 = a43 + b42 + c4 +d……….2 (x = 4, y = 15.30)
20.40 = a163 + b162 + c16 +d…….3 (x = 16, y = 20.40)
20.85 = a173 + b172 + c17 +d……...4 (x = 17, y = 20.85)
The answer from polysimultaneous equation solver was:
a = -0.00439
b = 0.164
c = -1.38
d = 18.5
So the model function is: y = -0.00439x3 + 0.164x2 - 1.38x + 18.5
The model function fits the data points obediently.
Since the shape of the graph resembles the curve of a sine function too, therefore the sine regression function in the calculator was used to find another function that models the same data, and compared with the model function that was obtained algebraically:
Though the sine function shows a great deal of similarity in behaviour to the cubic function when it comes to fitting the data points, minor differences can be appreciated. There are noteworthy differences when it comes to y and x intersects of both functions. The y intersects for both functions differ by 0.1 units from each other. The x intersects are entirely different for both functions as sine function is a periodic function whereas the model function is a cubic function which intersects the x axis at x = 31.6 (shown later). Yet both functions follow the data points obediently.
To find the BMI of a 30-year-old woman in the US using the model function, the expanded version of the graph is studied:
As appears in the graph above, the BMI of a 30-year-old woman in the US according to this model function is approximately 6, which is evidently unrealistic. The average BMI for adult women in the US is 22.5 [1]. This is because the model function in question is confined to ages 2-20 years, and may not be relevant to ages beyond that.
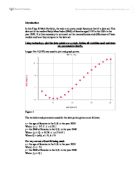
The following set of BMI data (age and median BMI) for urban girls in Shaanxi, China was obtained from the internet [2] in order to see whether the model function fits this data or not:
The data was plotted and the model function graphed, but the model function does not fit the graph of the plotted data and hence some changes had to be made to the model function. Once again using the polysimultaneous equation solver in the calculator, different combinations of variables (x, y) from table 2 were tried until the right combination that fitted the graph well was reached. The combination is:
14.7 = a(5)3 + b(5)2 + c(5) + d….1 (x = 5, y = 14.7)
16.2 = a(10)3 + b(10)2 + c(10) + d….2 (x = 10, y = 16.2)
16.8 = a(11)3 + b(11)2 + c(11) + d….3 (x = 11, y = 16.8)
19.4 = a(15)3 + b(15)2 + c(15) + d….4 (x = 15, y = 19.4)
The answer from polysimultaneous equation solver was:
a = -0.004, b = 0.15, c = -1.31, d = 17.9
The modified model function for this data is: y = -0.004x3 + 0.154x2 – 1.31x + 17.9
The modified model function now appears to fit the graph of the data well.
Limitations to the model function are:
- The model function is obtained from a specific combination of variables (x, y) since other combinations result in different behaviours of the model function.
- It is unique for the particular range of age provided in the data. This implies that the BMI for ages outside that range cannot be correctly estimated. As seen in case of the 30-year-old woman in the US (fig 1.4).
- It cannot be applicable to BMI data for females from another country. The model function needs to be modified to fit the data points. As seen in fig 2.2
References: 1.http://www.massgeneral.org/children/adolescenthealth/articles/aa_body_mass_index.aspx
2. http://www.ijbs.org/User/ContentfullText.aspx?volumeNo=1&StartPage=57&Type=pdf