To clear the third column’s third row to a 0, the last column should be multiplied by 3
Finally to make the second column contain a 1, the second row is divided by 2.
All that is left is the coefficients of the equation:
a=1, b=10, c=-1
therefore the quadratic equation: y=x2 +10x-1
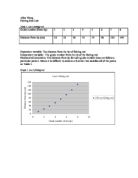
Table 3. Data points of Quadratic Function
The process that I used for the cubic function was by calculator.
y= ax3 +bx2 +cx+ d (cubic)
Table 2. Data points of Cubic Function
Thus, the equation of the cubic equation is y =.063x3 +.392x2 +11.7x-2.286
Cubic Function Graph (above)
Quadratic Function (above)
The main difference between quadratic and cubic functions is that a quadratic equation is a polynomial fit using three points while a cubic function uses four or more points and is a polynomial regression. With a higher degree for a polynomial function, there is a less degree of accuracy, especially when the guide number increases. The quadratic model is more precise than the quadratic function when the guide number reached 7 and 8.
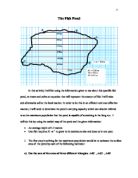
I used the function to find a function which passes through every data point in Table 1. With the 7th degree in a polynomial, it will pass through every data point of Leo’s fishing rod.
Subsitution of Table 1’s x and y values to is as followed:
Using the coefficients of each equation, I plugged it in the calculator by a 8*9 matrix.
Then using the reduced row echelon, I found the coefficient of the polynomical function which passes through every data point.
Table 3. Reduced Row Echelon of Polynomial Function
The polynomial function above should be the most accurate out of all the equations because it is based on all of the guide numbers of the fishing rods. With a higher degree of power for a polynomial, there should be a more accurate and fitting equation.
.
Table 4. Polynomial function table of values.
I found the table of values for the polynomial function did not provide accurate results.When the guide number reached 5, the distance from tip dramatically decreased.
Using technology, I found the quadratic regression as another function that fit the data.
Thus the equation figures is 1.24x+8.458x+.839
The data points of the quadratic regression formula is extremely accurate. The distance from tip points (y values) are only off by a tenth or so compared to the original data points.
Ironically, I found the quadratic model the most accurate out of the three functions. The data points on the table were closely associated to the original data points than the cubic or high degree of polynomial function. When both the degree of a function and the guide number gets higher, the accuracy and precision decreases dramatically.
Based on the quadratic model of y=x2 +10x-1, adding a ninth guide from the the tip of the fishing rod could be accomplished easily. Using the table of values of the graph, it was found that the distance from the tip would be 170 centimeters, which is 60 centimeters from the end of the fishing rod (shown below).
Table 5. Mark’s fishing rod
The quadratic model of y=x2 +10x-1 fits the new data adequately. Although the fit of the quadratic function is not perfect, it closely represents the data provided.
Using Excel, the line of best fit was considered y= 0.9345x + 7.7202x + 2.0536 as a polynomial function. The quadratic model of y=x2 +10x-1 and the line of best fit are extremely similar (demonstrated on the graph below). The narrower function is the line of best fit and the wider function is the quadratic model. My quadratic model could be more vertically compressed by multiplying the value of a (from y=a2+bx+c) by a positive integer. The limitations of the quadratic model is that it is only suited for fishing rods that are similar to Leo’s. If the distance from tip of each guide number of a fishing rod is substantially different that Leo’s fishing rod, the quadratic model of y=x2 +10x-1 will not work. In this case, Mark’s distance from tip of each guide number was similar to Leo’s. Thus, the quadratic model worked for Mark’s fishing rod.