Investigating the Graphs of Sine Functions
Math Methods
Internal Assessment No. 1
Investigating the Graphs of Sine Function
Type: I
Word Count: 1210
December , 2008
Candidate Name: Daniella Johnson Atwi
Part 1
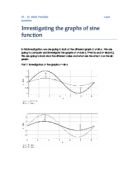
Graph of: y = sin x
Characteristics of this function
* It has three complete cycles
* Period of the function = 2?
* Amplitude = 1
* Maximum = 1
* Minimum = -1
* Centerline: y = 0 (x-axis)
Comparison of graphs: y = 2sinx,
y = 0.3 sinx,
y = 5sinx
The graph above illustrates the sine function with several values (coefficients). Each sine function taken is displayed in a different color to differentiate between them and distinguish the shapes of each one. The graphs above are dilated versions of y=sinx, they are vertically stretched. The bigger the coefficient is, the bigger the amplitude.
The similarities existent between the graphs is that they all have the same period (2?) and a centerline (y=0). However, the difference between them is the amplitude and and minimum and maximum values that they reach. For y= 2sin(x), the amplitude is 2, the maximum is 2, and the minimum is -2. Similarly, for y= 5sin(x) and y= sin (x). The amplitude and maximum are equal to the coefficient of y=sin (x), and the minimum is equal to the negative value of that coefficient.
The value of A is responsible for the vertical dilation. The dilation only affects the amplitude of the curve, (how high it reaches) however its position and period remain the same, for this reason all the curves intersect at the same points on the x-axis no matter what their amplitude (A) is.
Consider the two function y= 2sinx and y=-2sin(x)
* Amplitude= 2
* Minimum = -2
* Maximum = 2
These two functions, although differing in their coefficient, have the same amplitude, minimum and maximum. However, their shapes differ, in that y=-2sin(x) is a reflection of y=2sin(x) about the x-axis (i.e. whenever one is at its maximum, the other will be at its minimum). Therefore, the sign of A affects the curve by reflecting it about the x-axis.
In conclusion, the graph of y= A sin(x) compared to y= sin(x) has the ...
This is a preview of the whole essay
Consider the two function y= 2sinx and y=-2sin(x)
* Amplitude= 2
* Minimum = -2
* Maximum = 2
These two functions, although differing in their coefficient, have the same amplitude, minimum and maximum. However, their shapes differ, in that y=-2sin(x) is a reflection of y=2sin(x) about the x-axis (i.e. whenever one is at its maximum, the other will be at its minimum). Therefore, the sign of A affects the curve by reflecting it about the x-axis.
In conclusion, the graph of y= A sin(x) compared to y= sin(x) has the same period (2?), an amplitude of ?A?, a maximum of ?A?, and a minimum of -?A?.
However, if A is < 0, the graph is a reflection of y= ?A?sinx, about the x-axis.
Part 2
Investigation of graphs of the type y = sinBx
Unlike the graphs of functions y= A sin(x), the graphs of y=sin(Bx) have the same amplitude(1), maximum (1), minimum (-1) and the same centerline y=0.
The change in theses graphs however is the period. All the x values now will be divided by B.. As the value of B increases, the period decreases, and as B decreases, the period increases.
y= sin (2x) --> period: ?
y = sin (0.5x) --> period: 4 ?
y= sin (5x) --> period: ?
If the sign of B is reversed, (negative sign), the same effect will be observed as in A, the minimums and maximums of the function will be reversed, this is due to the rule sin(-x) = -sin(x). Hence, a negative value of B will cause a reflection about the x-axis.
In conclusion, the graph of y=sinB(x) compared to y=sin(x) has an amplitude of 1 but a period which is represented by ? . If the value of B is negative, the graph will be a reflection of y=sin?B?x about the x-axis.
Part 3
Investigation of graphs of the type y = sin(x+C)
The graphs illustrated above are for the investigation of the effect of transformations on position of graphs, since the amplitude (1) and period (2?) remain the same. Since in the above functions a certain value is added to the x, it is the case of a horizontal translation to the left since the values added are positive. If the values of C were negative then the graph would move to the right according to the value of C (2 units, 5 units...)
In conclusion, the value of C doesn't not effect the amplitude or the period of the function, only its position along the x-axis. Graphs of the function y = sin(x+C)
Shift C units to the left of the x-axis, while graphs of the function y = sin(x-C)
Shift C units to the right.
Part 4
A) y = 3sin (2(x+2))
The following graph will undergo a vertical dilation of factor 3,a horizontal dilation of factor 2, and horizontal translation of 2 units to the left. Starting from the original graph for the sine function, the y values should be multiplied by a factor of 3,the amplitude will become 3. The x values should be divided by a factor of 2, period will become ? and add another +2 to the values of x which will move it 2 units to the left.
B) y = sin 3(x + 1)
The following graph will undergo a vertical dilation of factor 0.5, horizontal dilation of factor 3, and horizontal translation +1 untis to the left. Starting from the original graph for the sine function, the y values should be multiplied by a factor of ,amplitude will become . The x values should be divided by a factor of 3,period will become ? and add another +1 to the values of x which will move it 1 unit to the left.
C) y = -sin (x-1)
The following graph will undergo a reflection along the x-axis due to the negative sign, a horizontal dilation of factor (), and horizontal translation (-1) units to the right. Starting from the original graph for the sine function, the minimums and maximums should be reversed, The x values should be divided by a factor of 0.5, (multiplied by a factor of 2), period will become 4? and subtract -1 to the values of x which will move it 1 unit to the right.
In conclusion,
Y=A sinB(x + C)
For different values of A: the value of A affects the y values. As A increases, the amplitude increases and the graph stretches along the y-axis. The amplitude of the function is ?A?. If A is < 0, the graph is a reflected about the x-axis.
For different values of B: the value of B affects the x values. As B increases, the period decreases. The period of the graph will be ? . If the value of B is negative, the graph will be a reflection of y=sin?B?x about the x-axis.
For different values of C: the values of C affects the x-values. A positive value of C translates the graph C units to the left, and a negative value of C shifts the graph horizontally C units to the right.
Part 5
The graphs of sine functions and cosine functions are similar in that they both take the shape of a waveform graph, they have a period of 2? and an amplitude of 1. However, they are also different; the cosine function is shifted units to the left of the sine function. In order to transform the cosine function from the sine, A remains the same = 1, the period B is also =1, and C= .
The graph of y=sin(x + ) is identical to y=cosx
0
Mia Malda Atwi Sine Function