Imagine the earth covered completely by water. As the earth spins, this water is balanced evenly on all sides by centrifugal force. The moon has a gravitational pull on this layer of water as it orbits the earth. This pull causes the water to bulge toward the moon. Because the earth is spinning there will be a bulge on the opposite side of the earth as well. As the earth rotates on its axis, each location on the earth will experience both tidal bulges. The areas of high water levels are high tides and the areas of low levels are low tides. Since the earth and the moon rotate around the sun, there is an added modifying factor. When the sun and moon are aligned, there are exceptionally strong gravitational forces. These cause very high and very low tides, which are called spring tides, though they have nothing to do with the season. When the sun and moon are not aligned, the gravitational forces cancel each other out. The tides are not as dramatically high or low. These are called neap tides. Spring tides and neap tide levels are about 20% higher or lower than the average height. Tides vary from day to day, as the earth, moon, and sun orbit, their positions constantly shift, causing slightly different gravitational effects. This causes the tides to occur at slightly different times. Tides also vary from place to place. Geographical position determines the level of tide.
All bodies of water have tides. Most people don’t think lakes have tides, because the tides are so small. In the open ocean the tides are relatively small (about 2 or 3 feet). When the ocean waters meet land, the tides become larger, especially in bays and harbours. In our area of the world we have, on average, two high and two low tides and the corresponding floods and ebbs of these tides each day. Our tides change about every 6 hours 13 minutes; with a full tidal cycle in about 12 hours and 30 minutes. Each day the high tide is about an hour later as it takes the moon approximately 24 hours and 50 minutes to completely rotate around the earth.
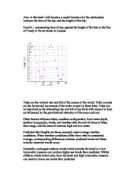
As it can be seen a sin wave graph has been formed.
The general rule for a sin graph is y = A sin (B*t) + C
Where A is the amplitude and equals = (maximum-minimum)/2
= (12.3-0.7)/2
= 5.8 = A
And B is the period and equals 13 = 2∏/B
B= 2∏/13
To find C we may take the maximum point so:
12.3 = 5.8 sin (15 * 2∏/13) + C
12.3 = 5.8 (1) +C
C = 6.5
So the function for the graph is: 5.8 sin( t * 2/13) + 6.5 = y and lets call it function 1
Now to see how much the new function fits on the original graph we will place the 2 functions together:
Graph 2.1 representing function 1 with the graph of 1.1
The blue curve is of function 1 while the scatter plot is of the original values of the tide.
As it can be seen the graph of function 1 does not fit much on the original values of the tide height.
So maybe if the graph form changed to this form y = A sin (B*t + D) + C it may fit more on the original graph:
Now D has a rule so we can find it
D = (maximum point + minimum point) / 2
D = (12.3+0.7)/2
D = 6.5
So the new rule is 5.8 sin (t * 2∏/13 +6.5) + 6.5 and lets call it function 2
Graph 3.1 representing function 2 with the graph 1.1
Now this graph will be produced and as it can be seen, this function (function 2) fits more on the original graph than function 1. However it still does not fit really much on the original graph of the time against tide height.
So now as a good sailor you will have to launch your boat on an outgoing tide, so these tides will be present when the graph of the function 2 moves from a maximum point to a minimum point. So using a graphical display calculator the maximum point in the graph at time 5.6(AST) and the minimum is at 18.6 (AST).
So a good sailor would go out between 5.6-18.6.
However now we have to find a best fit function for the original graph, this can be done using a graphical display calculator:
So A=5.71
B=0.51
D=0.20
C=6.59
So the general rule is now 5.71 sin (0.51t + 0.2) + 6.59
Lets call this function, function star
And if we plot function star with the original graph we will obtain:
Graph 4.1
So as it can be seen this function fits perfectly to the original graph compared to function 1 and function 2. Since function star passes through all points of the general graph while the other functions were barely passing 2 points out of 24 so they only fit about 8.33% to the original graph.
Now if we consider the time of the day with the height of the tide on the 28 of December 2003 with our star function we will get the following graph:
Graph5.1:
Where the blue line represents the star function.
Now as it can be seen the star function does not fit at all on these new set of data of December 28 2003 however if these data are filled into the graphical display calculator the best fit graph can be found:
So if we consider the function in the following shape:
y = A sin (B*t + D) + C
So A=5.34
B=0.51
D=-0.26
C=6.58
So the general function for December 28 2003 is:
5.34 sin (0.51t – 0.26) + 6.58
Now it is clear that at different days in the year we have different general functions showing the relation between the time of the day and the height of the tide and this is due to many reasons such as:
- prolonged onshore winds (wind towards the land), increase the sea level
- high barometric pressure can result in lower sea levels than predicted
- The position of the moon compared to that of the earth, because the moons attraction to the water this pull causes the water to bulge toward the moon. And at different times the moons position is different causing its gravitational pull to be altered to a certain body of water
- The position of the sun compared to that of the moon since the sun also has a gravitational on earth, so if the moons position was between earth and sun the highest gravitational force will be exerted and so the highest tide
- The friction between water and the waters body ground, the higher the friction the lower the tide height
- The temperature so at higher temperature water expands, increasing the volume of water making tides higher