A period is defined as the time for one full cycle to take place in the graph. The period of this graph is 12 since the data was collected over the span of a year, or 12 months.
In this function, the B-value represents the horizontal dilation. The horizontal dilation is the horizontal stretch or compression. This affects how long it takes for the data to be collected. Since the period is 12 months, we can calculate 2π/12 to find the value for B. In this situation, B is equal to π/6.
In this function, the phase shift, or variable C, is a horizontal translation to the left or right. The value is simply 1 (or -1 when inserted into the parent equation).
In this function, the vertical shift, or variable D, is a vertical translation up or down. By finding the mean of all the data points, you will conclude with a D-value, which is the average of all the temperature data points. In my situation, the value would be 6.667.
With the information concluded above, the resulting cosine equation should look like this:
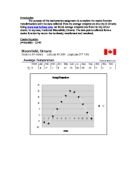
y = 13.5cos ((π/6)(x – 1)) + 6.667
Put onto a graph, the line looks like this when put alongside the data points:
The cosine equation is almost tracing the stat point line, so this equation must be close to being perfectly correct. The entire function seems to be slightly shifted to the left, but for the most part, it is in unison with the stat points.
If I were to do the same investigation but use a city lower than Canada, all the data points would be a higher value since temperatures will rise as we get closer to the equator. For example, if we were to analyze Lexington, Tennessee, all the temperatures are clearly higher. They don’t drop lower than zero and rise higher than Forest’s maximum temperature. Just like Forest though, the wavelengths of the temperatures will be just as large since the temperatures varies greatly depending on season. Other than these variables, the rest will remain similar since all the weather reports are collected from the same source so everything is consistent.
In the southern hemisphere, the temperatures are much more intense. The function will not be inverted since the temperatures are so high. All the variables will, again, remain similar, but the amplitude is very small. The function is close to being a straight line since the temperature is, for the most part, the same the whole year.