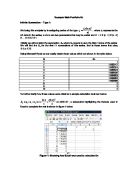
Table 1: Values of when , ,
In order to visualize the set of data, a graph can be plotted based on the values of .
Figure 1: Value of when
Observation of both Table 1 and Figure 1 suggest that the value of increases, approaching 2 as the value of approaches . With the numbers rounded up to six decimal places, the result of the last three terms round up to the number 2. Thus, a statement about the relationship between the values of and can be made using limitation. This is denoted as following:
Next, another set of values, and will be used to formulate another sequence:
Using the same mechanism as done with values and , the value of can be calculated using GDC. Table 2 shows the values of as increases, when and . Using the table, a graph can be plotted in order to visualize the relationship between the values of and .
Table 2: Values of when , ,
Figure 2: Value of when
Again, observing Table 2 and Figure 2, a noticeable pattern of the numbers is that the values of approaches 3 as approaches . Another generalization using limitation can be made, as denoted following:
Now, a general sequence with the value as 1 will be used to derive a generalized statement.
Since calculating an exact value of an undefined number is not possible, an attempt will be made to generalize a statement about using multiple values for . Below, in Figure 3, a graph was plotted using the values when , , , , , , , , and , using the method used previously.
Figure 3: Values fo with multiple values
Here, depending on the value of , the values of approaches relative values of . When , approaches 4 as approaches , and when , approaches 10 as approaches . Without loss of generality, a general statement can be drawn, denoted as following:
Now that a general statement for an undefined is established, the investigation will expand to encompass two undefined numbers, and . The sum of will be determined, where
Here, , the sum of the first terms for various values of and . In order to compare the sums and discover patterns from various values, the value will be set at 9 and the value will be set at 2. Below, Table 3 shows the calculated values for , using the same method for calculating values of .
Table 3: Values of for
A visible trait in Table 3 is that as the values of increase in a nearly exponential pattern. For , the value of approaches 2, approaches 4, 8, and so on. This draws a hint about the general pattern of the sum of an infinite sequence when the value is fixed. In order to visualize the values for an analysis of a pattern, Figure 4 plots the values on a graph.
Figure 4: Values of when
Along with the data values of , the exponential graph of is plotted for comparative analysis. Observing the values suggests that the exponential graph of matches the values of , which allows a generalized statement:
In order to reach a conclusion, values of for , , and will be analyzed. Table 4 shows the data calculated via the same method used previously.
Table 4: Values of for different values
In order to analyze the influence of values on the graph of values, a graph is plotted below. (See Figure 5)
Figure 5: with different and values
Figure 5, along with exponential graphs , , and , show the tendency of of the to match the relative exponential graphs with each values matching the base of the relative exponential functions. This leads to a general statement about the tendency of each equation.
This leads to a general statement:
In final statement of the general traits discovered in this assignment, the values of in the sums of the infinite sequences are accountable for the precision of the sums to the value of . The values are accountable for the exponent of the value of that is reached by the sequence. Finally, the values are accountable for the base of the equation, whereas also influencing the distance of the data values to the tendency of the values to match the function: .
Thus, encompassing all the data and statements derived from previous analyses, a general conclusion can be drawn:
There are limitations to this statement. Since the values of all data stretch infinitely when put in their actual form, the values were correct to six decimal places. Thus, at some point as the values increased, the data showed no difference in the sum of the sequence despite the increase of the value. For instance, in Table 1, the values of for , , and showed no visible difference. The expression of using six decimal places also accounts for the decline of the inclination of the data to match the general statement as the values increased.
Through this assignment, an attempt to discover a general statement about an infinite sequence was undertaken. A general statement has been reached, taking a step further into ‘knowing the infinity.’ Despite the limitations of the precision of number values, the general statement provides a glimpse into the unknown realm of infinity. Mankind has always strived to achieve the ‘impossible.’ This report, along with many great works of numerous mathematicians, shall be an additional proof of mankind’s attempt to tame the infinity.
END