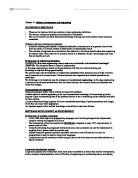
2.4 Typical Vapour-Compression System
A flow diagram of a simple vapour-compression system is shown in figure, the principle parts of the system are; an evaporator, whose function it is to provide a heat transfer surface through which heat can pass form the refrigerated space or product into the vaporising refrigerant. A suction line, which conveys the low pressure vapour from the evaporator to the suction inlet of the compressor. A vapour compressor, whose function is to remove the vapour from the evaporator and to raise the temperature and pressure of the vapour to a point such that the vapour can be condensed with normally available condensing media. A “hot-gas “or discharge line, which delivers the high pressure, high-temperature vapour from the discharge of the compressor to the condenser. A condenser, whose purpose it is to provide a heat transfer surface through which heat passes from the hot refrigerant vapour to the condensing medium. A receiver tank, which provides storage for the condensed liquid so that a (Flow Diagram of Simple Vapour Compression System) constant supply of liquid is available to the evaporator as needed. A liquid line, which carries the liquid refrigerant from the receiver tank to the refrigerant flow control. A refrigerant flow control, whose function it is to meter the proper amount of refrigerant to the liquid entering the evaporator so that the liquid will vaporise in he evaporator at the desired low temperature.
2.5 Typical Vapour-Compression Cycle
Starting at the receiver tank high temperature, high-pressure liquid refrigerant flows from the receiver tank through the liquid line to the refrigerant flow control. The pressure of the liquid is reduced to the evaporator pressure as the liquid passes through the refrigerant flow control so that the saturation temperature of the refrigerant entering the evaporator will be below the temperature of the refrigerated space.
In the evaporator, the liquid vaporises at a constant pressure and temperature as heat to supply the latent heat of vaporisation passes from the refrigerated space through the walls of the evaporator to the vaporising liquid. By the action of the compressor, the vapour resulting from the vaporisation is drawn from the evaporator through the suction inlet of the compressor. The vapour leaving the evaporator is saturated and its temperature and pressure are the same as those of the vaporising liquid. While flowing through the suction line from the evaporator to the compressor, the vapour usually absorbs heat from the air surrounding the suction line and becomes superheated. Although the temperature of the vapour increases somewhat in the suction line as the result of super heated, the pressure of the vapour entering the compressor is the same as the vaporising pressure. (Actually the pressure of the vapour decreases slightly between the evaporator and compressor because of the friction loss in the suction line resulting from the flow.)
In the compressor, the temperature and pressure of the vapour are raised by compression, and the high-temperature, high-pressure vapour is discharge from the compressor into the hot-gas line. The vapour flows through the hot gas line to the condenser, where it gives up heat to the relatively cool air being drawn across the condenser by the condenser fan. As the hot vapour gives off heat to the cooler air, its temperature is reduced to the saturation temperature corresponding to its new higher pressure, and the vapour condenses back into the liquid state as additional heat is removed .By the time the refrigerant reaches the bottom of the condenser, all of the vapour is condensed and the liquid passes into the receiver tank, ready to be re-circulated.
Air conditioning condensers are similar to ordinary automobile radiators but are designed to withstand much higher pressure. A condenser is normally mounted in front of the car radiator so that it receives a high volume of air. Also an engine mounted fan blade, electrically powered fan motor provides additional condenser cooling air. Air passing over the condenser cools the hot high-pressure refrigerant gas causing it to condense into low-pressure liquid refrigerant.
3.0 The Chosen Automotive Air-Conditioning System
3.1 Project Definition and Goals
Project definition is understanding and controlling the air-conditioning system. Our goal is improving the performance by using different ways such as changing compressor.
3.2 DIAVIA Automotive Air-Conditioning System
As you know, air-conditioning system provides taking out the hot air from the car into the outside of the car. The main heat transfer occurs when refrigerant enters the evaporator and takes heat from the environment to vaporise. Compressor takes low pressure refrigerant and change into the high pressure vapor. After, refrigerant transferred into the condenser, it gives the heat into the outside environment. At that moment, refrigerant turns into liquid form. Finally, it turns back the evaporator by refrigerant flow control which controls the pressure difference between condenser and evaporator.
This refrigerant cycle is the major part of the system. Additional parts are using for improving efficiency, additional control and preventing damages.
3.3 Information Flow Diagram
Need; Cooling the air in the car.
{Input; need of cool air}
{Output; cool air}
3.4 System Variables, Unknowns and Equations
-
P1 ; exit pressure at the evaporator
-
P2 ; exit pressure at the compressor
-
P3 ; exit pressure at the condenser
-
P4 ; exit pressure at the refrigerant flow control
-
h1 ; enthalpy at the area 1
-
h2 ; enthalpy at the area 2
-
h3 ; enthalpy at the area 3
-
h4 ; enthalpy at the area 4
-
T1 ; exit temperature of the evaporator
-
T2 ; exit temperature of the compressor
-
T3 ; exit temperature of the condenser
-
T4 ; exit temperature of the refrigerant flow control
-
Wout ; Work done by the system
-
Win ; Work gained
-
Qout ; Given heat
-
Qin ; Taken heat
-
Qnet ; Net heat
-
Wnet ; Net work
-
Performance; Performance of the system • System has 19 variables.
3.5 Mathematical Modeling
Figure shows Pressure – Enthalpy Graph
Figure shows Pressure – Temperature Graph
Y = a0 + a1X + a2X2 We determined these 3 points (3,0)
(5,20)
(6,20)
-
a0 + 3a1 + 9a2 = 0
-
a0 + 5a1 + 25a2 = 0
-
a0 + 6a1 + 36a2 = 0
-
a0 = -35.001
-
a1 = 14.166
-
a2 = -0.833
T = a0 + a1P+ 9a2P2
• Fallowing values were read from the previous graphs.
-
P1 = P4 = 2.0 kg/cm3
-
P 2 = P3 = 14.0 kg/cm3
-
h1 ; 138 kcal/kg
-
h2 ; 145 kcal/kg
-
h3 ; 110 kcal/kg
-
h4 ; 110 kcal/kg
-
Wout = 0
-
T1 = T4 = -10.001 0C
-
T2 = T3 = 55.0025 0C
- m = 0.05 kg/s
After finding these variables, we have 6 unknown variables left. To determine the unknowns; we found following equations.
Also,
We calculated our system’s performance by using these equations.
-
Win = m * (h2 – h1) = (145 – 136) * 0.05 * 4.18 = 1.463 kj/s
-
Qin = m * (h1 – h4) = (138 – 110) * 0.05 * 4.18 = 5.852 kj/s
-
Qout = m * (h3 – h2) = (110 – 145) * 0.05 * 4.18 = -7.315 kj/s
-
Performance = Qin / Wnet = 5.852 / 1.463 = 4
As we mentioned before, our aim is improving the performance of the system. From this view, we will try to reduce Wnet which equals to Win.
We have mentioned that, we can able to reduce Win by using different compressor types. In the following, you will find our studies which uses different type of compressors.
4.0 Simulation
4.1 Studies on Different Types of Compressors
The chart below shows the capacity of an 8 cubic inch YORK compressor using R-12 at a high-side pressure of 14 kg/cm3 and a low-side (evaporator) pressure of 2 kg/cm3
- For a 5 cubic inch compressor, multiply the power and capacity given below by 625.
-
For a 7 cubic inch compressor multiply by .875.
Input power;
1 kW = 1.34 Hp.
Capacity;
1kW-h = 3,410 Btu/hr
Color implies better performance results
4.2 Other Alternatives for Improving the System
-
Qin (the heat given by evaporator) can be raise in order to increase the performance. This implies, changing on T,P and h values.
-
increasing h1
-
decreasing h2
-
decreasing h4
5.0 Optimization
In this section of the project, our objective is minimizing the power which is consumed by compressor. To achieve our aim; we substitute some constraints and equations from the graphs. In addition, we have three more constraints, which are from simulation section.
Power = -1 + rpm/500
Efficiency = 70.98 – 0.00133rpm – 0.00000133rpm2
Capacity = 0.011rpm – 0.000001rpm2
Constraints from simulation section;
Efficiency ≥ 4
The refrigeration capacity is the enthalpy change between stages 2 and 3 = 145-110
Capacity =35 * 0.4 = 14*1000 Btu/lb
Capacity ≥ 14 (justified to graph)
The engine rpm of a vehicle can be determined from simulation part ;
RPM ≥ 1000
5.1 Gams Code
The whole code is given at the appendix part.(8.1)
5.2 Gams Code’s Solution Result
The whole solution results are given at appendix part.(8.2)
We found objective value is equal to 1.9377 which is power of the compressor.
6.0 Dynamic Behavior of the System
Our automotive air conditioning system can be defined with;
- refrigeration capacity
- compressor power
- condenser heat
- evaporator heat
- energy balance
And
- heat for chamber as defined in mathematical modeling part of the project.
Under steady state conditions are;
- Q transferred = Q in (evaporator)
- Qout (condenser)=Q in(evaporator) + Win(compressor)
Operating variables are;
Tc (compressor temperature) ............. -10°C
Te (evaporator temperature)................ 55°C
Tcab (cabin temperature) ....................22°C
Win (power)...........................................1,4 kj/s
Qout (compressor).................................7,3 kj/s
Qin (evaporator)....................................5,8 kj/s
Physical constants are;
Ambient temperature
Heat transfer coefficient
Flow rate
Unsteady state;
Case; We assumed that after the air conditioner runs for a couple of minutes, the cabin temperature is decreased 30°C to 22°C .Then, it is fixed to 22°C and the temperature in cabin is controlled by a thermostat system. When a passenger opens the door, the cabin temperature raises from 22°C to 25°C.
So;
-
Q transferred ≠ Q in (evaporator)
-
Q transferred = Q in (evaporator) + mc (ΔTs/dt)
For our system, the dry bulb air temperature was specified as 55 °C (130 F). However, an allowance must be made for a temperature rise in air as it travels along the duct work and across the blower. A temperature pick-up of 10 F is added to the air entering the cowl grille.
The temperature of the air at the inlet face of the evaporator is then 130 + 10 =140 F.
The air temperature leaving the evaporator, by specification is 55 F. (12°C)
So, we can conclude that (under conditions that we assumed before; Qin (evaporator) 5,8 kj/s and ambient temperature 30°C and set temperature 22°C) ; cooling rate of air conditioner is 0,012 °C / s.
So as a result of the 3°C (25°C - 22°C) difference thermostat starts the system again. Compressor gets power, condenser gives heat, compressor takes heat and cycle will continue… As a conclusion, after 3 / 0,012 = 4,5 minutes system will be again at the set temperature 22 °C.
R(s) Y(s)
+
-
R(s) Tset Y(s)
+
Tmeasured -
R(s) Tset -Tset , 0 Y(s)
+
Tmeasured -
6.1 On-Off Control
This is the simplest form of control, used by almost all domestic thermostats. When the cabin is cooler than the set-point temperature the heater is turned on at maximum power, M, and once the oven is hotter than the set-point temperature the heater is switched off completely. The turn-on and turn-off temperatures are deliberately made to differ by a small amount, known as the hysteresis H, to prevent noise from switching the heater rapidly and unnecessarily when the temperature is near the set-point. The fluctuations in temperature shown on the graph are significantly larger than the hysteresis, as can be confirmed with the interactive simulation due to the significant heat capacity of the heating element.
7.0 Conclusion
In our project, we have studied on air conditioning systems. We have tried to understand their current structures, working principles and tried to improve the compressor’s power consumption. For certainty, we made some assumptions and took some values constant such as; the circumstances of the environment. We have mathematically modeled our system to construct an engineering approach. In simulation we measured the better performance results. These results guided us at optimization section in our project. Optimization section was our hardest job to do. We determined our constraints and tried to find best compressor power consumption value under fixed conditions. We used Gams software package to make calculations at computer. Later, we tried to find the dynamic behavior of the system. We took a demo case to test our air condition system’s flexibility. Our case was; what happens if a passenger enters the automobile. Starting this point, we tried to understand our system’s control structure and we agreed to construct an on/off control structure. Finally, we concluded that, designing and understanding a system is a hard job. However, after our studies we found a better power consumption rate. Therefore, it shows us every system can really needs some improvements. On the other hand, of course our project needs some unit or assumption corrections but we believe that our design (air conditioning system with our compressor rates) works better than the existing one.
8.0 Appendix
8.1 Gams Code
POSITIVE VARIABLES
POWER
RPM
EFF
CAP;
FREE VARIABLE Z;
EQUATIONS
RPMEFF
CAPRPM
POWERRPM
OPT1
OPT2
OPT3
OBJ;
OBJ..Z=E=POWER;
RPMEFF..70.98-(0.00133*RPM)-(0.00000133*RPM*RPM)=E=EFF;
CAPRPM..(0.011*RPM)-(0.000001*RPM*RPM)=E=CAP;
POWERRPM..-1+(RPM/500)=E=POWER;
OPT1..EFF=G=4;
OPT2..RPM=G=1000;
OPT3..CAP=G=14;
MODEL SYSDES /ALL/;
SOLVE SYSDES USING NLP MINIMIZING Z
8.2 Gams Code’s Results
GAMS 2.50.094 DOS Extended/C 01/05/03 15:21:36 PAGE 1
G e n e r a l A l g e b r a i c M o d e l i n g S y s t e m
C o m p i l a t i o n
1 POSITIVE VARIABLES
2 POWER
3 RPM
4 EFF
5 CAP;
6
7 FREE VARIABLE Z;
8
9
10 EQUATIONS
11
12 RPMEFF
13 CAPRPM
14 POWERRPM
15 OPT1
16 OPT2
17 OPT3
18 OBJ;
19
20 OBJ..Z=E=POWER;
21 RPMEFF..70.98-(0.00133*RPM)-(0.00000133*RPM*RPM)=E=EFF;
22 CAPRPM..(0.011*RPM)-(0.000001*RPM*RPM)=E=CAP;
23 POWERRPM..-1+(RPM/500)=E=POWER;
24 OPT1..EFF=G=4;
25 OPT2..RPM=G=1000;
26 OPT3..CAP=G=14;
27
28
29
30
31 MODEL SYSDES /ALL/;
32 SOLVE SYSDES USING NLP MINIMIZING Z
33
COMPILATION TIME = 0.000 SECONDS 0.1 Mb WAT-50-094
GAMS 2.50.094 DOS Extended/C 01/05/03 15:21:36 PAGE 4
G e n e r a l A l g e b r a i c M o d e l i n g S y s t e m
Model Statistics SOLVE SYSDES USING NLP FROM LINE 32
MODEL STATISTICS
BLOCKS OF EQUATIONS 7 SINGLE EQUATIONS 7
BLOCKS OF VARIABLES 5 SINGLE VARIABLES 5
NON ZERO ELEMENTS 11 NON LINEAR N-Z 2
DERIVATIVE POOL 5 CONSTANT POOL 12
CODE LENGTH 49
S O L V E S U M M A R Y
MODEL SYSDES OBJECTIVE Z
TYPE NLP DIRECTION MINIMIZE
SOLVER CONOPT FROM LINE 32
**** SOLVER STATUS 1 NORMAL COMPLETION
**** MODEL STATUS 2 LOCALLY OPTIMAL
**** OBJECTIVE VALUE 1.9377
RESOURCE USAGE, LIMIT 0.059 1000.000
ITERATION COUNT, LIMIT 8 10000
EVALUATION ERRORS 0 0
Work length = 0.03 Mbytes
Estimate = 0.03 Mbytes
Max used = 0.01 Mbytes
LOWER LEVEL UPPER MARGINAL
---- EQU RPMEFF -70.980 -70.980 -70.980 EPS
---- EQU CAPRPM . . . 0.248
---- EQU POWERRPM 1.000 1.000 1.000 -1.000
---- EQU OPT1 4.000 66.157 +INF .
---- EQU OPT2 1000.000 1468.871 +INF .
---- EQU OPT3 14.000 14.000 +INF 0.248
---- EQU OBJ . . . 1.000
LOWER LEVEL UPPER MARGINAL
---- VAR POWER . 1.938 +INF .
---- VAR RPM . 1468.871 +INF .
---- VAR EFF . 66.157 +INF .
---- VAR CAP . 14.000 +INF .
---- VAR Z -INF 1.938 +INF .
**** REPORT SUMMARY : 0 NONOPT
0 INFEASIBLE
0 UNBOUNDED
0 ERRORS
Parameters
-
P2 ; exit pressure at the pump
-
P3 ; initial pressure of the gas entering burning room
-
h1 ; enthalpy at P1
-
h2 ; enthalpy at P2
-
ha ; enthalpy at the area 1
-
hb ; enthalpy at the area 2
-
hc ; enthalpy at the area 3
-
hd ; enthalpy at the area 4
-
T2 ; temperature of the cold water in the system for usage
-
T3 ; temperature of the hot water in the system for usage
-
Tin; initial temperature of the water entering to the exchanger
-
Tp1; temperature of the water entering the pump
-
Tp2; temperature of the water leaving the pump
-
Qloss ; energy loss from the chimney
-
Qin ; energy used by the system
-
Apipe ; area of the pipe in the exchanger
-
Kpipe ; coefficient of the material used in the pipe
-
Ksmallpipe ; coefficient of the material used in the small pipe
Parameters
-
P2 = 1,5 atm
-
P3 = 0.25 bar
-
h1
-
h2
-
ha
-
hb
-
hc
-
hd
-
T2 = 10 °C
-
T3 = 45 °C
-
Tp1 = 49 °C
-
Tp2 = 48 °C
-
Qloss = 0.7 of the Qi
-
Qi = 0.93 of the Qin
-
Apipe = 0,036 m2
-
Kpipe ; coefficient of the material used in the pipe
-
Ksmallpipe ; coefficient of the material used in the small pipe
Variables
-
Qin ; initial energy converted by burning room
-
T1 ; temperature of the water converted by the exchanger
-
Tout ; temperature of the hot water in the system
- L ; lenght of the radiator
-
Tin ; initial temperature of the water entering to the exchanger
-
P1 ; pressure of the water entering the pump
Pump equations
Win = (h2 – h1) = vΔP
Exchanger equations
For normal exchanger
Apipe * Kpipe * ΔT\Δx = m*c* ΔT = m(ha – hb)
For small exchanger
Apipe * Kpipe * ΔT\Δx = m*c* ΔT = m(hc – hd)
Radiator equations
2100 cal\m*L = m*c*ΔT
Burning room equations
Qin = mq
Balance equations
Qin = Qloss + Qi