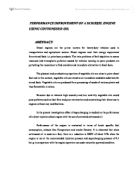
Stage 3
Reservoir is submerged in hot water container.
Stage 4
Remove masses from platform.
Stage 5
Reservoir is moved into the cold water container.
Calculations for changing experimental results to PV diagram
Pressure of States
To find the pressure exerted on the air in the closed volume the fallowing adaption’s were to the pressure formula
P = Pressure in system (Pa), F = Force of piston (N), A = Area of the piston bottom (m²) [1]
m = mass of piston (kg), g = gravity (9.8m/s), r = radius (m)
Pressure of State 2, 3
= mass of weight (kg)
Note: Pressure depends on which state is been calculated to take into account if the mass of the weights should be added in with the piston mass.
Volume of air during states
= Total volume in the closed system
= Volume of outside tubing
= Volume of tubing inside the heat engine
= Volume in the cylinder under the piston
h = height of piston (m)
Specific volume of air
Ideal gas law equation
[1]
= specific volume of air (m³/Kg), R = Gas constant (287 J/Kg/K), T = temperature (K), P = pressure (Pa)
Results
Table 1 Pressure and volume calculated from results of 3 experiments
Graphs
The experimental results taken consist of the height of the piston and the temperature within its state. In the fallowing graphs pressure and volume are plotted to represent the 5 states. On completing the cycle losses in the system have lead to different finishing state.
Graph 1 Experiment 1 PV diagram
Graph 2 Experiment 2 PV diagram
Graph 3 Experiment 3 PV diagram
Analysis
Work done between each state
To calculate the work done between each state the change of system process has to be determined.
The fallowing formulas represent the change of system process in mathematical terms
Adiabatic process
= work done between states 1 + 2, P = pressure [1]
= volume at state 2, = volume state 1
Isothermal process
[1]
= work done between states 3 + 4, P = pressure, = volume at state 3, = volume at state 4
Internal energy between states
= Internal energy, m = mass, u = specific internal energy [1]
= Specific heat capacity of air at the different temperature states
m = mass, V = volume of air in the closed system, = specific volume [1]
1st law of a closed system
Q = heat transfer to the system, W = work done by the system, ∆E increase in system energy [1]
= heat transfer during the different states, = work done during the different states, = internal energy between states
Max thermal efficiency
For comparison of the heat engines overall efficiency it is required to work out the max theoretical efficiency of the heat engine under a perfect enviorment
[1]
= efficiency, = Temperature of cold water, = Temperature of hot water
Actual thermal efficiency
The actual thermal efficiency of the heat engine shows a far lower efficiency to that of the already poor max thermal efficiency.
[1]
W = total work done by the system, = total heat extracted from hot reservoir
Results
Table 2 Results for calculations of performance of the heat engine.
Assumptions
When placing the reservoir in the water baths it was assumed that total heat transfer occur immediately between the water and the air in the closed system.
There is no loss of air through leaking in the tubes.
The piston is perfectly air tight between the walls of the cylinder.
No friction occurs between the piston and the cylinder.
Discussion
Experimental
After closing the shut-off valve the weight of the piston compress the air in the system till it comes to equilibrium. This creates the closed system and the starting state (state 1). During this process the temperature of air remains constant, though loss of air from leaking would have already begun.
In the cycle state 1-2 the weight is increased on the piston causing an increase in pressure within the closed system. Adiabatic process occurs as the air is been compress resulting in no heat transfer but a temperature increases. Losses occur due to friction and heat losses from compressing the air.
In state2-3 the pressure of the piston remains constant as it is free to move within the cylinder. The heat transfer leads to the volume of air increasing causing the piston to move up resulting in work been done. Assuming that the heat transfer between the heat source and air occurs slowly enough it can be shown that constant temperature is maintained forming an Isothermal process.
In the cycle process of State 3-4. Pressurised gas will slowly expand back out to counter balance the displaced pressure of the weight. Due to heat and friction losses in this state and the other states the piston does not reach its max potential height. Isothermal process occurs here as heat is added to increased volume of air. This results in the air expanding and doing work on the piston.
In the cycle state 4-5 the air in the closed system slowly cools back to the cold water temperature, resulting in the decrease of the air volume within the closed system. This reduces the pressure pushing the piston up and allows it to come back down. If the system was 100% efficient the position of the piston would be same position as stage 1. Isothermal process occurs here as heat is transferred to the cold water while temperature throughout remains constant.
Throughout each state losses occur due to friction, heat transfer and leaking of air within the closed system occur. Human error in reading values and maintaining constant time intervals between each state contribute further to marginal error.
Comparison of efficiencies
Efficiency result shows a decrease in efficiency of the heat engine as the temperature difference between cold and hot containers decrease.
Comparing results to max theoretical efficiency the actual efficiency of the heat engine shows far greater losses to what was predicted. In theory all margins of error would be ruled out and the experiment would be performed in a perfect environment for unbiased results.
Uncertainty Analysis for pressure
Information given
Piston mass ± 0.5 g
Piston diameter ± 0.1 mm
Assumed uncertainties
When working out the lengths of the tubes and diameters it was assumed that there was a large error in gathering data which lead to the fallowing uncertainties been assumed.
Volume of air in closed system ± 5 mm³
Height readings of piston ± 0.1 mm
To obtain an overall estimate uncertainty analysis was applied to the pressure formula for a percentage error in results
R = R (x1, x2, x3 .......xn)
= derivation of mass with respect to pressure, = uncertainty of mass, = derivation of radius with respect to pressure, = uncertainty of radius, = derivation of height with respect to pressure, = uncertainty of height,
= percent uncertainty of pressure calculation
Results for uncertainty analysis in pressure show a high percent of uncertainty in calculation results. This uncertainty could be taken as an example to the other uncertainties that would be seen in calculation results.
Conclusions
By using cyclic heat transfer the creation of heat engine can be achieved. It is found that during the different stages of the process huge losses of energy are lost through out. Due to these losses calculating the performance of the heat engine results in assumptions been made and neglecting losses in calculations.
References
[1] Introduction to thermal systems engineering. (Moran, Shapiro, Munson, Dewitt)