Full Factored Load = 68.12 kN/m = 0.06812 kN/mm, Dead Load = 25.80 kN/m = 0.0258 kN/mm
Column X-Section:
Member 3 X-Section:
()
Member 6 X-Section:
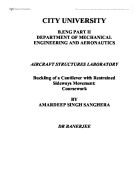
Once these values had all been placed into MASTAN2, the full factored load was placed onto members three and six and the first order analysis was performed on the structure. A bending moment diagram was the produced, using the facilities on the program, which can be seen in figure 3. Points of contraflexure are indicated by circles, there is one point on each of the vertical members and two points on each of the horizontal members. The locations of the points of contraflexure can be seen in table 1. Table 2 shows the maximum positive bending moments within the spans of members 3 and 6.
Table 1 – Locations of points of contraflexure in frame in Figure 1
Figure 3 – Frame under full factored load on members 3 and 6, showing bending moments and locations of contraflexure
Figure 4 – Frame under full factored load on members 3 and 6, showing exaggerated deflection
Table 2 – Maximum positive bending moments along span and location
Figure 4 shows the exaggerated deflected shape of the frame under the full factored load. It can be clearly seen from the comparison of figures 3 and 4 that the location of the maximum deflection is at the point of maximum bending moment along the horizontal spans. This is what would be expected as the larger the bending moment then the greater the effect on the member and thus a larger deflection. The values and locations of the maximum deflections in members 3 and 6 can be found in table 3.
Table 3 – Maximum deflection along members 3 and 6 and location
Figures 5 and 6 show the complete shear force and axial force diagrams for the frame under the full factored load respectively with the maximum values indicated on the diagrams.
Figure 5 – Frame showing shear force diagram and values of maximum shear force
Figure 6 – Frame showing axial force diagram and values of maximum axial force
There are a number of different loading combinations that can be applied to the frame that will affect the bending moments and shear forces of the different members. The following figures (7 – 12) show the bending moments and shear forces of all the different loading permutations.
Figure 7 – Bending moment diagram under dead load on member 3 and full load on member 6
Figure 8 – Shear force diagram under dead load on member 3 and full load on member 6
Figure 9 – Bending moment diagram under full load on member 3 and dead load on member 6
Figure 10 – Shear force diagram under full load on member 3 and dead load on member 6
Figure 11 – Bending moment diagram under dead load on member 3 and dead load on member 6
Figure 12 – Shear force diagram under dead load on member 3 and dead load on member 6
Table 4 – Bending moments at each node due to different load combinations (FF = Full load on member 3 and Full load on member 6, FD = Full load on member 3 and Dead load on member 6 etc.)
Table 5 – Maximum bending moments at mid span for members 3 and 6 under different loading combinations
With the information showing in tables 4 and 5 it is possible to draw a bending moment envelope for members 3 and 6 as can be seen in figure 13 below.
Figure 13 – Bending moment envelope for different loading permutations
3. SOLUTIONS TO PROBLEM 2
For this task we were required to analyse a bridge structure. The structure (figure 2) is used to support a bridge deck that is suspended from cables at the locations of the loads (15 in total), which are equally spaced apart. It was decided that the bridge be made from a rectangular cross section of concrete measuring 0.25m by 0.25m and as such has the following properties: E = 2.8*107 kN/m2, I = bd3/12 = 3.255*10-4 m4 and A = 0.0625 m2 .
The arch was to be constructed from three different shapes (a sin curve, a parabola and a circular arc) and for each case three different dimensional conditions were applied (H = L/2, H = L/4, H = L/8). Each arch was to be compared against one another for each dimensional condition to find the most efficient one. The following equations were created to find the y-coordinates of the arches that were to be created in MASTAN2:
a) H = L/2 Sin Curve:
Parabola Curve:
Circular Arc:
b) H = L/4 Sin Curve:
Parabola Curve:
Circular Arc:
c) H = L/8 Sin Curve:
Parabola Curve:
Circular Arc:
Using the above equations a table of the coordinates to be used was created using excel as can be seen in table 6.
Table 6 – y-coordinates for all curve styles and dimensional conditions
Using the material properties, geometry and the information in table 6 the curves were created in MASTAN2 and first order analysis was performed on each one, assuming the arch to be a plane frame with straight segments between loads.
Figure 14 – H = L/2 Sin curve deflected shape
Figure 15 – H = L/2 Sin curve bending moment
Figure 16 – H = L/2 Parabola Curve deflected shape
Figure 17 – H = L/2 Parabola curve bending moment
Figure 18 – H = L/2 Circular arc deflected shape
Figure 19 – H = L/2 Circular arc bending moment
Figure 20 – H = L/4 Sin curve deflected shape
Figure 21 – H = L/4 Sin curve bending moment
Figure 22 – H = L/4 Parabola curve deflected shape
Figure 23 – H = L/4 Parabola curve bending moment
Figure 24 – H = L/4 Circular arc deflected shape
Figure 25 – H = L/4 Circular arc bending moment
Figure 26 – H = L/8 Sin curve deflected shape
Figure 27 – H = L/8 Sin curve bending moment
Figure 28 – H = L/8 Parabola curve deflected shape
Figure 29 – H = L/8 Parabola curve bending moment
Figure 30 – H = L/8 Circular arc deflected shape
Figure 31 – H = L/8 Circular arc bending moment
Table 7 – Maximum bending moments and axial stresses, minimum axial stresses and eccentricity between min and max axial stresses
From the analysis of the information in the bending moment diagrams and the maximum bending moments in table 7 the most suitable and efficient type of curve can be chosen for each dimensional condition. It is clear that for each case (H = L/2, H = L/4, H = L/8) that the most efficient curve is in fact the parabolic type as it has. In the case of H = L/2 the parabolic curve has a maximum bending moment lower than 0.5% of that of the circular arc. In the case of H = L/8 the parabolic curve is still the most efficient but the difference has been reduced compared to the circular arc with the parabola being 63.4% smaller compared to 95.5% smaller in the H = L/2 case.
4. CONCLUSIONS
-
The full stiffness matrix, K, for the frame in figure 1 is K = [27x27], its partitions are, and
-
The maximum bending moments in the spans of members 3 and 6 are 2.872*105 kNmm (3.44m from left) and 1.23*105 kNmm (3.84m from left) respectively
- The maximum deflections in the spans of members 3 and 6 are 9.5mm (3.7m from left) and 1.92mm (3.6m from left)
- The maximum deflections are roughly located at the points of maximum bending moment
- Using different combinations of the dead load and full factored load, values for the maximum bending moments and shear forces could be seen and a bending moment envelope could be created for members 3 and 6
- The difference between different types of curve (sin, parabola, circular) can greatly affect the size of the bending moments in an arch shaped support
- In the case of H = L/2, H = L/4 and H = L/8, the parabolic curve proved to be the most efficient type of curve as its bending moments were greatly lower than those of the sin curve or circular arc shaped arches