2.5 Wiener process
A wiener process is a specific type of Markov process where the random variable z is drawn from a normal distribution with a mean of 0 and a standard deviation of 1. [2]
2.6 Random number (z)
There are a number of ways in which to generate random numbers. Below will explain how to generate random numbers in Microsoft excel.
N(0,1) is a particular case of the normal distribution where the mean, is 0, and the standard deviation, is 1, from the general form of the normal distribution N(.
In order to calculate a normally distributed random number with mean 0 and standard deviation 1 using this alternative method we need to implement the following formula:-
ε, is normally distributed random number
Ri is simply a random number generated using the ‘rand()’ function found under ‘math & trig’.
In order to implement this function, 12 random numbers need to be generated using this generator. The values of the 12 figures will be added together using the ‘sum’ function and take 6 from this value. To generate more the row will just need to be copied down to the relevant number of rows needed, for example can be copied down to 1000. This will show 1000 normally distributed random numbers.
2.7 Historical data
The historical data needed has been collected in order for this project to be implemented and one way of creating a software that will allow investors to estimate future stock prices. The historical data is taken from DataStream via FTSE100 and will consist of three years’ worth of closing share prices for a number of various companies. Historical data is being used in order to estimate future stock prices. Stock prices are observed at fixed intervals of time that will be used in this project including daily, weekly and monthly. Volatility can be estimated by the movement of stock prices.
2.8 Risk Measure (V-a-R)
A well-known risk measure is Value at Risk (V-a-R); this was first used by major financial firms in the late 1980’s. This is a widely used of the on a specific of financial assets and will be used in this project. Three different types of models exist for estimating Value at Risk, these include the variance-covariance (VCV) assuming that risk factor returns are always (jointly) normally distributed and that the change in portfolio value is linearly dependent on all risk factor returns. Historical simulation is the simplest and most transparent method of calculation. This involves running the current portfolio across a set of historical price changes to yield a distribution of changes in portfolio value, and computing a percentile (V-a-R). The benefits of this method are its simplicity to implement, and the fact that it does not assume a of asset returns. Lastly, is where future asset returns are more or less randomly simulated. [4] This is the most complex and difficult method to understand and implement. This model will be explained further on the next page.
2.9 Monte Carlo Simulation (V-a-R)
Monte Carlo simulation method is one approach used to calculate value at risk and the approach that will be constructed within this project and applied to a stock price. The Monte Carlo simulation will predict the worst likely loss of a potential stock given a confidence interval over a specified period of time.
This simulation generates a number of random outcomes and each time it is run a different outcome is generated, these results can be displayed on a histogram showing the historical pattern. For example if 100 trials are conducted each time the results would be different but near enough similar each time it is being calculated.
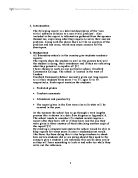
Diagram 2.1 [5]
The histogram above shows an illustration of the Monte Carlo simulation indicating the 5 possible worst outcomes that could occur in a frequency of 100 random trials. The worst outcomes would be -15% and -20%. The three outcomes that are also shown to be a risk are between -20% and 25%. The V-a-R confidence level here is 95% as 5% is the worst outcomes. Summarising this illustration no more than 15% will be lost in any given month.
Chapter 3: Software Design
3.1 Data
Gathering of data will come from DataStream, the world’s largest financial and statistical database from the FTSE100, which lists the most highly capitalised UK companies in the London Stock Exchange (LSE). Out of the data thirty companies will be chosen which will be implicated within the software and giving the investors a choice to choose from. The data will be daily historical closing prices of the companies and the returns will be generated using this data.
3.2 Description of Software and language
The main user friendly interface will be created in Microsoft Excel with the help of Visual Basic Application (VBA). Microsoft Excel and Visual Basic Application (VBA) is being used to put the project together as both have relevant functions needed, such as ease of coding within VBA, outputting graphs through built in functions such as command buttons with Microsoft Excel, both will calculate volatility and covariance of a stock. The returns and standard deviation for each company will also be calculated using built in functions in Microsoft excel.
Coding in VBA can be time consuming and complicated, problems can also occur but as mentioned built in functions to help with calculations of the data will help minimise the problems. The built in functions in Microsoft excel work well with Visual Basic Applications (VBA) and will be used to calculate the main objectives which are GBM and V-a-R values.
‘Loops’ and ‘for statements’ will be applied in VBA in order for the software to run smoothly and for calculations to be done correctly. Validation will be put in place to reduce errors.
3.3 Initial overview of software
Microsoft Excel and visual basic application (VBA) will be used as this uses Microsoft graphic user interface which is familiar with most users. Both applications work well together and have many built in functions that will make the process of calculations less time consuming and more user friendly to use, as discussed in section 3.2.
Key aims to accomplish:
- With the historical prices of stocks the covariance will be calculated (returns).
- User forms will be created making it user friendly and easy to use, creating option buttons, list boxes, text boxes and command buttons.
- Geometric Brownian motion (Ito’s lemma) will be implemented into the coding. The style of the coding will make the software accept user defined variables such as implementing error coding, then implementing output coding to show the GBM and V-a-R values of the chosen stock from the user.
- The user will be asked to select one stock, once a stock is chosen the mui and sigma of the stock will be calculated as well as its initial stock value. This will be done using a button function in VBA.
- The user will then be able to proceed to select a time step of daily, weekly or monthly.
- The user will proceed to select confidence levels of either 95% or 99%, output a graph and calculate the V-a-R value.
- The user will finally be able to analyse its chosen stock and see whether it is risky or not by the outputs obtained.
Chapter 4: Design implementation
4.1 Improvements from the design stage
During the implementation stage of the software a few changes have been made in order to improve the initial design. The user would have been able to enter in how many simulations they required in user form 3. However, after some consideration it was decided that it would be best to have the user with options to select from, as throughout the software the user is not required to fill in any fields therefore it was best to keep it all option based. This would hopefully give a positive effect on users using the software as no errors could be made inputting data because that would not be an option.
During the implementation of user form 4 called ‘GBM’ the trend line on the graph has been removed as it could add confusion as to what the graph will be illustrating; keeping the graph as a histogram on its own illustrating the frequency of future stock prices would make it more user-friendly and easy to understand.
Validation checks have been put in place in user forms 4 and 5, before the user can proceed to the next user form the command buttons ‘Calculate GBM’ and ‘Calculate V-a-R’ should have been clicked and results displayed in order for the ‘Next’ command button to be enabled and for the user to proceed. This was decided to make sure the user gets all the findings needed and makes use of the whole software.
User form 6 no longer will have a command button called ‘Back’, as once the user has got their GBM findings illustrated in a histogram and their V-a-R calculated and outputted in labelled text boxes, the user would surely be satisfied before proceeding to finish, so therefore the ‘Back’ command button has been removed from user form 6. This user form will allow the user to exit the software or to start again.
Chapter 5: Testing
5.1 Introduction
This chapter will consist of testing different aspects of the software. This will ensure that the software is working accurately and the way it has been programmed to do. More importantly it should output GBM and V-a-R figures correctly and appropriately, this chapter will demonstrate that these have been tested and found to be successful. During the implementation stage validations had been put in place, this chapter will also test to verify that these validations are done correctly and put in the right places; this is to ensure the user will not be misled in any parts of the software.
There will be two test tables in this chapter, one table will consist of the functionality of the software and the other the validations of the software. Functionality of the software will test all command buttons, option buttons and text boxes, making sure that outputs are outputted into the correct places and into the correct text boxes. The validation testing will ensure that all validations are working perfectly and the users input will be managed via error messages if inputs are not done precisely.
The purpose of testing and what the outcome should be and whether it has been successful will be shown in tables throughout this chapter. Each test will be individually illustrated using screen shots from the software while it is being run.
5.2 Functionality test table
5.3 Validation test table
Chapter 6: Results Analysis
6.1 Introduction
This chapter will analyse how the V-a-R value varies depending on the number of simulations required. The software gives an option of 100, 500 or 1000 simulations and all have been tested to observe if the figure depends on the number of simulations entered. Two tables have been constructed for the company ‘ITV’, one table has the input of confidence interval as 95% and the other as 99% this will also test how sensitive the V-a-R figure would be depending on a users input of the confidence interval. The time increment being tested within this test is daily.
6.2 Results
Table 6.1
Table 6.2
Table 6.1 illustrates the results of potential loses an investor could make if ITV is chosen as the company and a confidence level of 95%. Each simulation has been tested ten times keeping the company, time increment and confidence interval the same which produces different V-a-R results which are illustrated in the table. The more the simulation the lower the risk of losing on a potential stock would be. For example, looking at the findings in table 6.1 out of the possible ten different V-a-R values for each simulation, the smallest value has been deducted from the highest value and the difference is highlighted to establish the distribution of the values (Volatility).
Another factor that could possible effect the V-a-R value would be the confidence interval level chosen, as mentioned the more simulations the better, however, a 95% confidence interval level in figure 6.1 clearly shows a better V-a-R value, the same has been done for figure 6.2 but the confidence interval level is 99% and by looking carefully at the results, it still proves that the more simulations there are regardless of the interval level the less risky the stock can be but a higher interval level could still have an impact on the risk. This can be analysed by looking at how the results differ on each table as everything stays constant apart from the confidence interval level.
By observing table 6.1 and table 6.2 it is fair to say that a lower confidence interval level and the more simulations chosen makes it more beneficial for the users chosen stock.
The higher the difference value indicates there is a chance of a high risk of losing on a potential stock within the simulation chosen. This concludes that the more simulations a user choose the less risky the stock will be. For example, looking at table 6.2 and the result under 1000 simulations the highest possible risk would be that there is a 1% chance that 7.99% could be lost and the lowest being 7.10% making the difference between the two 0.89%, whereas under 100 simulations the highest risk would be 1% chance of losing 9.20% and the lowest 6.90% making the difference 2.30%.
The differences indicates the distribution of the V-a-R values, a potential investor could chose confidence interval level of 99% even though the V-a-R values are high because there would only be a 1% chance of losing on a profit.
Chapter 7: Critical appraisal
7.1 Introduction
As with many software’s there are a few strengths and weaknesses. In this chapter, the strengths and weaknesses will be highlighted and discussed, whether any improvements could be made will be mentioned and if the aims have been met within the project as a whole.
7.2 Strengths
Outputting GBM findings into a worksheet and then plotting them into a graph as a histogram plotting the frequency of potential stock prices (GBM), then uses that histogram to output a V-a-R figure. The V-a-R figure shown in percentage notifies the user of how much could be lost depending on their chosen confidence interval, an added strength to this is that the user is able to go back and reset the GBM findings and calculate the V-a-R again to get a different figure (Table 6.1 and 6.2), the new figure will not be a dramatic change but gives the user a rough idea of the percentage that can be lost. By using these methods for calculating stock prices and measuring risk the main aim of the software has been accomplished. In order for accuracy of V-a-R the GBM values had to sort in ascending order from smallest to largest, this was an achievement as it was done through coding in VBA; shown in chapter 4, figure 4.4.
All validations are in place and therefore make the software user friendly and easy to use as this will aid the user if any errors are being made; this is an added bonus to the software as message boxes appear. There is an added feature to the textboxes as each text box in user form 2 has a description as to what is being shown in the text box, all the text boxes are locked, therefore figures in the textboxes cannot be adjusted.
The user manual is well documented and provides a step by step guide on how to use the software this allows the user to gain further understanding and help of the software. The software has a graphical user interface (GUI) which is well constructed and enables the user to use the software easily as buttons and option buttons were implemented within the interfaces for ease of use.
7.3 Weaknesses
There have been a few weaknesses with the software. One weakness is that the user is only able to select one company; this could have been protracted in allowing the user to select more than one company. This would have been a beneficial point to the user as two companies or more could be compared and if the user would like to get findings for more than one stock they would not need to run the software each time for a separate company.
Another weakness is that the user only has an option of three simulations which is 100, 500 and 1000. This could limit the user to what they actually what to find as they could want a simulation of 300 or 800 and so on. These simulations are given to the user as option buttons and one has to be selected, this could have been modified where the user can input how many simulations they required instead of having three options to choose from.
The final weakness in the software is the implementation of GBM and V-a-R both produce findings and results but on different user forms, as this software has been created to be user friendly and easy to understand these could have both been implemented and produced in one user form so the user can see the potential future stock prices plotted in a histogram as well as the V-a-R value against each other.
7.4 Improvements
Improvements have been made from the initial design stage of the software to the main implementation stage as illustrated and discussed in chapter 4, 4.1. However this section will discuss what could be improved if more time was available.
Time management was a key issue within creating this software; if more time was available there could have been many aspects of the software that could have been improved. Main points that could have been improved if more time was available will be discussed below.
For security reasons the worksheets in Microsoft Excel could have been hidden this would have added extra protection to the software as the user would have no access to the worksheets, therefore will not be able to modify any of the results and see calculations being computed. This would have added privacy to the software.
The simulation model used to estimate future stock prices was Geometric Brownian motion alone. Another model could have been used which would allow the user to compare differences in stock prices. The GARCH model could have been implemented but as this is a complex model as discussed in chapter 2 this would only have been possible if time was extended. An advantage of the model is that it uses a time varying volatility and is more accurate in simulating stock prices than the GBM model.
There is an option of three different simulations the user can choose from, this could be improved where the user is able to input how many simulations they actually require instead of having to choose from only three options, this is also seen as a weakness and is explained under weaknesses. If time was available this would be changed and improved.
Chapter 8: Conclusion
Having researched simulation models and measures of risk in order to be able to implement a well structured software for potential investors to use has been the main success of this project. Risk has been a major consideration in deciding whether to take advantage of investment opportunities or by rejecting investment opportunities for the reason that they may seem too risky. Geometric Brownian motion, a simulation model has been used to estimate potential stock prices and Value-at-Risk; Monte Carlo method has been used to measure the risk of the stock. The Monte Carlo method uses normally distributed random numbers in order to calculate V-a-R; this method was the most appropriate to use and implement as discussed in chapter 2: 2.9. Distributions of future stock prices are produced from historical data using the Geometric Brownian motion formula (Ito’s lemma).
Chapter 3 mentions how the historical data was gathered, through DataStream. Daily closing stock prices of 3 years were taken from the FTSE 100 and thirty were chosen to be applied in the software available to the user. This data was needed in order for the software to be created as it was made from raw data and computed into user forms and formulas to produce and meet the aims of the project.
Chapter 4 demonstrates the use of Microsoft Excel with Visual Basic Application (VBA). Both worked well together as Excel was more like the back bone of VBA. Using VBA, a graphical user interface (GUI) was created using it’s built in functions and user forms which allowed the software to work appropriately and outputted relevant results that the user was able to analyse. GBM was coded in VBA and outputted into Excel to create a graph which was then outputted into a user form through VBA. Having said that not most of the functions in VBA were easy to implement, problems did arise therefore research had to be done in order to learn more and produce what was needed and getting the software to work properly.
The aims of the project have been met seeing that a user friendly software has been created in order to estimate future stock prices and calculate its V-a-R. Testing of the software has been successful with no errors and complications, results obtained have been appropriate easy to understand and can be based on real life financial situations.
From the initial design stage to the completion of the project there have been ups and downs throughout but with great motivation and support this has been a successful project!
Chapter 9: User Manual
Introduction
This manual will guide the user through the software; each step will be illustrated and labelled, each label being explained. The main purpose of the software is to calculate stock prices using Geometric Brownian Motion, measuring its risk by V-a-R.
Before proceeding further the following requirements are needed; an operating system of Windows XP or newer and the software needed is Microsoft office 2007 (Excel). The software will need to be opened directly from the CD-Rom and not from a copied version on the system.
If the above are available to the user then it is time to get started!
Open the program from the CD-Rom into Microsoft Excel, ensure all security checks are in place, and enable macros. This will ensure that all functions will run accordingly. To enable macros click the ‘Office button’, this will be located on the top left hand corner of the Excel window, then go to ‘Excel options’ > ‘Trust center’ > ‘Trust center settings’ > ‘Enable all macros’.
Once all of the above are done and available to the user, the user can get started with using the software.
Chapter 10: References
Reading, to gain further understanding of the main topics:
Hull, John C., Options, Futures, and Other Derivatives, 5th ed., Prentice Hall, 2002.
Hull, John C., Fundamentals of futures and options markets, 7th ed., Pearson, 2011.
Neil A, Chriss., Black schools and beyond: Option pricing methods, McGraw-Hill companies,1997.