Bernoulli's equation shows that the sum of the three quantities is a constant.
In this experiment, the duct is horizontal; therefore, there is no gravitational effect. In this case we could ignore the gz term. It is then convenient to express the static pressure, P as an equivalent head of liquid h (=p/ρg), and hence the Bernoulli’s equation becomes:
h + v2 = CONSTANT
2g
Apparatus
The set-up consists of a pipe of constant diameter, then a short contraction to a narrow throat followed by a long diffuser and finally a pipe of the same size as the original one. This arrangement is referred to as a Venturi.
Experimental Procedure
Start the pump and initiate a flow of water through the test section. Regulate the flow using the flow meter to 46 Litres/Min. Allow the some few minutes for the flow to regulate and then take manometer readings for tapings 1 to 10. Repeat the procedure for different flow rates; 34 Litres/Min. and 24 Litres/Min.
Results
The table shows the tapping numbers, the distance from the tapping number 1 and the cross-section diameter at each tapping
Discussion
From analysing the results we can see that as cross-sectional area decreases the velocity of the fluid inside increases to maintain continuity and constant volumetric flow. The velocity of the fluid reaches its maximum at the throat where the venturi converges so that the cross-sectional area is at its minimum value.
Graph One represents the change in static head (pressure difference) along the duct. From the continuity equation; smaller the area, greater the velocity of the flow and hence the greater the velocity, lower the pressure. This can be clearly seen from the graph. Taping number 4 shows the greatest pressure difference in each flow rate. This is because it is the minimum cross-sectional area of the duct. The pressure head then decreases as the cross-sectional area increases (Tapings 5 – 10). Different flow rate also have different change in pressure head at each tapping. In this case, the change in pressure head is the greatest when the flow rate is at 46Litres/Min. Hence, it can be stated that fluids at high velocity experience low pressure. Therefore, it can concluded from the graph that as the cross-sectional area reduces, the velocity increases and hence the pressure reduces.
Graph Two, it is clearly noted that the variations of the normalised total head are very similar to the normalised static head. The normalised static head given by the formula [1-(d1/dn)4] represents the theoretical values of fluid flow. However, the values do not return to the zero value which shows that there is energy loss along the duct. This may be due to friction. The normalised head graphs vary slightly from the theoretical graphs which may be due high friction at higher velocities.
There is usually a noted difference in readings and analysis of experiments compared to theory. This take place due to several reasons; more common, the human reading error. There is an allowance of certain percentage to give the accuracy of value to be with a confined range.
Reading error: ± 0.1cm
Flow meter: ± 1Litre/Min
Graph Three shows the variant of normalised static pressure along the duct. We can visualise this from the flow rates of 34 l/min and 46 l/min after the decrease in pressure there is a rise in pressure variation then it falls again. This can be a human error created by misread readings or a fault with the apparatus. The variation should in theory look more like the 26 l/min flow plot.
Error Analysis
Variations between practical and theoretical results are common in most experiments. Due to the conditions of our investigations our results are always suspect to error, which is why an error analysis calculation is used to give us a clearer idea of how accurate our results are. The main errors are usually caused by human error due to misread readings. Error build up due to use of approximated values carried out in calculations and errors due to incorrect calibration of equipment are also key factors.
Every measurement made is susceptible to error. In many investigations errors can be deduced at the beginning of the test. In this case the static head is the only unit measured in the investigation it has an error of:-
δQ = ± 1 l/min
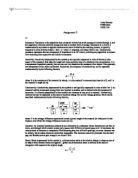
The data obtained from the flow rate (Q) is used in the continuity equation to find velocity (V). As it has been established an error is found in the flow rate it is obvious then to state that there is an error in the velocity. To find the error in the velocity, it must be known that the proliferation of errors in a quotient is expressed by this formula:-
(δV/ | V |) = √((δQ/ | Q | )2 + (δA/ | A |)2
Where (| Q |), is the best value estimate and the term (δX/ | X |) is the relative error, which expresses an error in the form of a percentage.
In this case we can say that:-
(δA/ | A |)2 = 0
Therefore:-
(δV/ | V |) = ((δQ/ | Q |)
(δV/ | V |) = (0.00001/0.0005778) = 0.02 = 2%
With respect to static head the error will be:-
δh1- hn = ± 1 mm
Re-arrange expression to give propagation error:-
(δh1- hn) = √((δhn)2 + (δh1))2
δ(hn- h1) = √((1)2 + (1))2
δ(hn- h1) = √(2)
(δh/ | H |) = (√(2)/1181.4) = 0.002 = 0.2%
In the case of Normalised Head:-
Nh = 1/V12(2g(hn- h1))
The 2g (g representing gravity (9.81)) is not considered because it has no error. If q = xn→ δq = n δq.
(δNh/ | Nh |) = √((δhn - h1) /| hn - h1 |)2 + (2δV1/ | V1 |)2
(δNh/ | Nh |) = √((0.2)2 + (2(2))2) = 4%
In the case of the total static head:-
Th = 1/V12 (2g(hn- h1)) + ((Vn / V1) 2)-1
To calculate error with ease it is easier to calculate the uncertainties in parts.
The percentage of error found in the second term T ((Vn / V1) 2)-1 is:-
T = √(2δV1/ | V1 |)2 + (2δV1/ | V1 |)2
T = √((2*4)2 + (2*2)2 = 9%
Hence the error in the sum is:-
δTh = √((δNh/ | Nh |)*| Nh |)2 + (T* | Vn-V1 |)2)
δTh = √((0.04*11.56)2 + (0.09*7.899)2
To calculate error of percentage:-
(δTh/| Th |) = (0.719/4.66) = 0.154 = 15.4%
Conclusion
After the analysing the data we have concluded that the error of our experiment has come to be 15.4%. The percentage of confidence is 84.6%, which is reasonably accurate. So our findings support the continuity equation. It is noted that velocity is proportional to the cross-sectional area of the duct, hence smaller the area, higher the velocity and vice-versa. This corresponds to the equation of continuity. It is also observed that when the velocity of fluid increases, the pressure decreases. Hence as the velocity of water in the venturi increased as it passed through the contraction, the pressure decreased and as the velocity decreased over a larger cross sectional area, the pressure increased. This proves Bernoulli’s theorem which states that at any point in a pipe through which a fluid is flowing, the sum of the pressure energy, the kinetic energy, and the potential energy of a given mass of the fluid is constant. This corresponds to the law of conservation of energy.