Apparatus:
· Funnel.
· Measuring cylinder.
· Stopwatch.
· Beaker.
· Hot Water
. Ice Cubes
· Pondweed.
· Water.
. Thermometer
Fair Test:
· The same pondweed must be used every time we change the light distance.
· Take results after one minute for each individual experiment.
Method:
· Collect apparatus.
· Set up apparatus as in diagram.
· Fill measuring cylinder and beaker with water.
· Each Minute, we would have different temperature.
· Start stopwatch.
· Count the bubbles for every one-minute, then write my results down on a paper.
Safety:
· Follow lab safety rules (e.g. no running bags at back etc).
· Keep the hot water away from your hands.
. Wear Goggles, and lab coat.
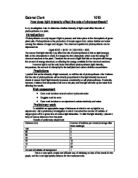
Results:
Graph:
Diagram:
Conclusion:
Looking at my results a can see a significant increase in the rate of
Photosynthesis as the temperature decreases. All of the results I was given show this pattern. In the experiment when the temperature was 60, it was when most of the bubbles came out, about 37bubble per-minute. However, when the temperature dropped, the number also dropped and decreased to about 5bubbles per minute. I believe this is because when the temperature is higher, the photosynthesis is faster, and better.