The variable we are using in this experiment is light intensity; the fact that all plants need light in order to photosynthesise has been proven many times in experiments, and so I can say without challenge that without light a plant would die. The reason that light intensity does affect the rate of photosynthesis is because as light, and therefore energy, falls on the chloroplasts in a leaf, the chlorophyll, which then makes the energy available for chemical reactions in the plant, traps it. So as the amount of sunlight, falls on the plant, more energy is absorbed, so more energy is available for the chemical reactions, and so more photosynthesis takes place at a given time.
Photosynthesis flow chart:
Light enters chlorophyll in grana remaining energy
chloroplast captures light energy carried to stroma
oxygen released some energy used
into the air to split water into
hydrogen and oxygen
stroma combines
hydrogen and carbon
hydrogen carried dioxide to make
to the stroma carbohydrates.
carbon dioxide carbohydrates carried
enters leaf to the cells of the plants
Apparatus:
- Test tube
- Canadian pond weed
- Test tube rack
- Lamp
- 30cc of tap water kept at room temperature
- Stop watch
-
5cc of sodium hydrogen carbonate (NaHCO3)
- A meter ruler
Diagram:
Method:
For this experiment we set the apparatus up as shown above, we chose to use a Canadian pond weed because it would be easier to see the oxygen coming off, so we could measure the rate of photosynthesis, we could not use a plant that lives outside of the water because they can’t photosynthesise in water. We used a lamp for our light source, a test tube containing the Canadian pondweed, 30cc of tap water and 5cc of sodium hydrogen carbonate; this increases the count of carbon dioxide so there is always enough CO2 for the reaction to be constantly taking place.
CO2 + H2O H+ + HCO3-
Sources of CO2
NaHCO3 Na+ + HCO3-
The test tube rack was there merely to hold the test tube upright, and the meter ruler we used to measure the distance between the lamp and the test tube. We used a stop clock to time the three-minute length for each trial. We did three trials for each distance so to get a more accurate average and we a wide range of distances from 5cm to 60cm every 5cm (5cm, 10cm, 15cm, 20cm, 25cm, 30cm, 35cm, 40cm, 45cm, 50cm, 55cm and 60cm).
Fair test:
In order to keep the experiment fair we only changed one variable and that was the light intensity, all of the other factors that affect the rate of photosynthesis we kept constant such as the colour of light and the temperature, we also used the same Canadian pond weed throughout the experiment, we used a meter ruler to measure the distance accurately between the test tube and the lamp. We also made sure that we left the lamp for 60 seconds before starting the experiment so it could adjust to the new light intensity. Last but very important we made sure that once the Canadian pond weed was introduced to the light it was always kept in the light until the end of our experiment.
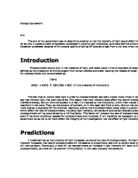
Prediction:
I predict that as the intensity of light increases, so will the rate of photosynthesis. I will also expect the graph to be a curve graph; this is because I believe that as the light intensity increases, the rate of photosynthesis will only increase at a proportional rate
until a certain level is reached at this point the rate of increase will go down, this is because an increase in light intensity will have no further effect on the rate of photosynthesis.
I also believe if the results are correct they will follow the inverse square law.
I = 1 Intensity = 1
D2 Distance2
Area full intensity
5cm
Light
4 x Area 0.25 intensity
10cm
Preliminary work:
Before performing the experiment we had to make a few decisions; how long to time each trial, how much water to use, how much NaHCO3 to use, how many trials to do and what measurements to do. Myself and my partner decided to time the experiment for 3minutes so we could obtain sufficient results and it was also a recommended time by our teacher, we used 30cc of water because we wanted to use a sufficient amount of water so we could see the pond weed photosynthesise, we also made the decision to use 5cc of NaHCO3 to speed up the rate of photosynthesis. We decided to put the lamp at a range from 5cm to 60cm from the test tube every 5cm because we came to the conclusion that the more measurements we took the better our results would be, we also thought that by taking three trials for each measurement so we would have a more accurate averaged result.
Results:
Table of results
Analysis:
Looking back at my prediction, my foresight was correct, this means that the rate of photosynthesis does increase as the light intensity increases. The reason for this is photosynthesis is a reaction, which needs energy from light to work, so the amount of energy available from light increases with the rise in light intensity, so, so did the amount of oxygen produced as a product of photosynthesis. The inverse square law was correct as when the distance doubled the light intensity decreased by 1
4
As is shown every result proves the inverse square law leaving a reasonable amount of room for error that is.
My graphs showed that the relationship between the light intensity and the rate of photosynthesis was not linear, as both graphs produced a best-fit curve. However, it appears also as I predicted the increase in rate was only proportional to the increase in light intensity for only part of the graph.
From my results I can gather that light intensity does most certainly have a large affect on the rate of photosynthesis. The gradual decrease in the rate of photosynthesis the shallowing gradient can be down to other factors limiting the rate of photosynthesis. As light intensity increases, the photosynthetic rate is being limited by certain factors, such as carbon dioxide and temperature. These factors do not immediately limit the rate of photosynthesis, but does in a long period of time.
When comparing and linking my results to the introduction, it was obvious that light would affect the rate of photosynthesis, as without the presence of light the chemical reaction for photosynthesis cannot take place.
Light energy + 6CO2 + 6H2O C6H12O6 + 6O2
Evaluation:
I think the experiment went well and we controlled the possible errors pretty well and I was left with a set of good results.
There were no major anomalies in my experiment but as always they were minor anomalies however I had expected more major out of place errors so I was passed pleased with the results I was left with. For example at 5cm for one trial we counted 170 bubbles when our average worked out to be 263 bubbles. Some of the errors that might result in the making of these areas are:
- We may have made an error in measuring the distance between light source and the Canadian pondweed could not be measured with a high degree of accuracy, especially keeping in mind the distance should have been measured exactly from the filament of the light bulb to the centre of the plant. This error will only cause a very slight error which will only affect the closest distances such as 5cm.there is no real correction for this error you would just have to measure as possibly as possible.
- As I mentioned in my introduction the concentration of carbon dioxide could also of been an error, but I do not think that it would be likely error as the experiment did not last long enough for the carbon dioxide level to get that low. This should not of been a problem as we added sodium hydrogen carbonate which will keep the carbon dioxide count high.
- Heat produced from the light bulb may have also played a minor effect on the rate of photosynthesis but also would only effect the closest of distances like 5cm. Although I do not think that this was a error to worry about we could prevent it by, placing a Perspex block between the lamp and the plant, which would absorb most of the heat, while allowing the light energy to pass through.
- Last and probably the biggest cause of error was that the experiment was performed in a room, which was already illuminated with the lights in the science lab and from other peoples experiments so it would speed up the rate of photosynthesis. We could have prevented this error by performing the experiment in separate rooms in the pitch black apart from the lamp used to as the light source for the experiment.
If I were to do this experiment again then I would start by remedying the errors that may of occurred in this experiment as I have explained above then I would make an other obvious change to create more reliable results and that is to do more trials for each distance to get an even better average.
I am confident now that I can draw a firm conclusion and that conclusion is, light intensity does have a large effect on the rate of photosynthesis and the greater the light intensity the greater the rate of photosynthesis.
If I were to do any follow up experiments after this I would investigate the effects of temperature and coloured lights on the rate of photosynthesis (experiment shown below.
Light Test tube with 30cc of tap water Filter Ray box
Meter at room temperature and 5cc of
sodium hydrogen carbonate.
The ray box provides a constant amount of light, the filter only lets the light required through and the light meter measures the light intensity, as different light will have a different level of intensity so the light meter will tell us how far away the ray box should be to achieve the right light intensity.