Demand and supply curve are both affected by determinants or factors. In the simple economic theory it is assumed that one of determinants change at a time with all the other factors remaining the same. This concept is called Ceteris Paribus and it helps to make this analysis easier. (Sloman, 2004)
The Price is a common determinant for both curves, but with an opposite effects. As previously explained, when price rises the demand tends to fall and the supply usually rises. The opposite occurs when the price falls, generating an increase in the quantity demanded and a decrease in the quantity supplied. (Lipczynski, 2004)
One of the main factors that influence the demand is the taste and preferences of consumers. The more desirable people find the goods, the more they will demand them and the higher will be the price they are willing to pay. Tastes are influenced by advertising, by fashion, and by concerns about health. However, the demand of a good is also largely influenced by its substitute goods. Goods with a large choice of alternative goods tend to be in less demand, especially if their price is higher. The same influence is exercised by complementary goods. When the price of a good raises, the demand for his complementary goods tend to fall. The demand for normal goods increases when income increases while the demand for inferior goods decreases. The opposite occurs when income decreases. This is due to the possibility that consumer have to spend more money and buy better quality products. When the price is expected to increase in the future, people will buy more now. Thus demand increase. (Sloman, 2004; Baye, 2005)
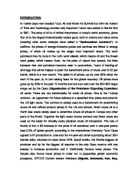
The graph 1 shows an increase of demand. The curve shift to the right from D1 to D2. As it shows the price increase from P1 to P2 and the quantity rise from Q1 to Q2. In this example the supply curve is held fixed. The factor that shifted the demand curve did not affect the supply.
These factors change the demand, increase or decrease, and are graphically represented with a shift to the right or the left of the curve.
The direct relationship between the price of a good and the quantity supplied is due to the higher profit gained as the price rises. Thus, a company is encouraged to produce more of a good as it becomes more profitable and reduce the production of other less profitable goods. When the price is kept high over a long period of time, new suppliers enter the market increasing supply. The higher the costs of production, the lower is the profit at each price. Thus, as the costs of production increases, firms decrease the supply and switch to produce goods with lower costs of production and higher profits. Changes in the costs of production can be due to changes of technology, increase or decrease of input prices (such as raw materials, wages and rent), government policy (subsidies and taxes) and when the production is re-organized. (Sloman, 2004; Lipczynski, 2004)
The supply of goods produced together, called goods in joint supply, increase or decrease together. When the price is expected to increase in the future, suppliers will stock more now to sell in the future. Thus supply decreases in the short term and increases in the future when the price rises. (Sloman, 2004; Lipczynski, 2004)
Demand and supply curves are both affected by unpredictable events, such as disease, war and natural events such as weather, earthquakes and floods. It is important to distinguish between the words demand and quantity demand. By demand is meant the whole curve while the quantity demand is the value of goods sold or purchased at a certain price. (Sloman, 2004; Young, 2002)
Combining the two analyses together establishes the equilibrium price and the equilibrium quantity. Graphically this is represented by merging the demand and the supply curves on to the same axes. The interception of the curves represents the equilibrium price, which is the point of balance where demand matches the supply. At this point consumers are willing to buy the same quantity that producers are willing to supply. This is also called equilibrium quantity. (Sloman, 2004)
In a free and competitive market economy, there is a natural price mechanism where the price is automatically balanced. If the price is too high, demand is low. This generates a surplus that drives down the price till reaching the equilibrium price. The opposite happens when the price is lower than equilibrium, where the high demand generates a shortage that drives up the price. When the equilibrium price is reached there is no shortage or surplus. (Sloman, 2004; Young, 2002)
The equilibrium price is held fixed until any of the previous factors shift one of the 2 curves. When this happen a new equilibrium (price and quantity) are generated. However, in real world more than one factor can change and both curves can shift at the same time. The new equilibrium price is changed to the new intersection of the curves. (Young, 2004; Baye, 2005)
This part of the essay focuses the attention on the case study of Safeway and the implication of the takeover of Morrisons. These are the application of the theory explained in the previous paragraphs.
As it appears on the Finch (2004) report, Safeway used to held almost 9% of the market share making them ranked as the 4th bigger retail store. Considering their proportion of the market, Safeway is not a completely a price taker, but it contributes to decide the price of their products along with the other 3 bigger retailers. (Sloman, 2004). By taking-over Safeway, Morrison has extended the number of store in the country and it is creating a new brand image. His portion of share of the market is now 14% and although it is still ranked as 4th, it is very close to the 3rd and 2nd bigger owners. This allows them to have a stronger power on the market and a higher ability to control the demand for their products.
The market structure where Safeway and the other retail store operate is called monopolistic competition. In this market structure there are many companies, but each one produce differentiated goods and has the control over their own prices. (Baye, 2005) However, the big stores where not allowed to takeover Safeway in order not to create and oligopoly going towards a monopoly. Safeway on its own did not have a huge portion of the market share, thus it did not have a full control over prices of its products and their demand. (Finch, 2004)
It is possible to increase the demand through advertising and a marketing campaign. By creating a brand image it is also possible to reduce the elasticity of the demand for their products and reduce the competition and the substitution effect. (Sloman, 2004) Moreover, to attract customers Safeway usually keeps its prices low. However, this is not an increasing in demand corresponding to a shift of the curve, but a movement along the same curve. Safeway had already created a brand name which should guarantee low prices at a good quality to increase and control the demand of their products. (Finch, 2004)
To sum up it is possible to conclude that demand and supply are affected by different and common determinant and they are not always predictable. In a free and competitive market economy the equilibrium price is maintain through a natural price mechanism. The equilibrium price and quantity represent the balance between the demand and the supply.
The companies that own a large share of the market usually have the control over the prices. These are called price maker. Smaller companies are called price taker. This is usually verified in the perfect competition market structure and monopolistic competition where there are bigger and smaller companies.
The government can intervene to prevent and avoid the formation of a monopoly or oligopoly, as in the case of big retail store such as Tesco wishing to takeover Safeways.
Bibliography:
Sloman, J. & Sutcliffe, M. (2004). Economics for Business. London: Prentice Hall, 3rd Edition.
Tutor2u ltd. (2005). Data retrieved from
on 20th December 2005
Young, R. (2002) University of Bristol. Data retrieved from
on 21st December 2005
Baye, M. R. (2005). Managerial Economics and Business Strategy. Boston: McGrow-Hill, 5th Edition.
Lipczynski, J. & Wilson, J. (2004). The Economics of business strategy. Harlow: Financial Times/Prentice Hall.
BBC News. 26th September 2003. Data retrieved from:
on 22nd December 2005
on 22nd December 2005
BBC News. 8th March 2004. Data retrieved from:
on 22nd December 2005
Finch, J. (23rd September 2004). The Guardian. Data retrieved from
on 4th January 2006