My report will advise and suggest which company I believe is the best investment.
Contents
Introduction...............................................................................3
Table of Findings..........................................................................4
Profitability Analysis
Gross Profit Margin.......................................................................5
Demand Curves..........................................................................7
Net Profit Margin.........................................................................8
Return On Capital Employed..........................................................9
Liquidity Analysis............................................................................................10
Current Ratio............................................................................11
Acid Test Ratio...........................................................................12
Conclusions..............................................................................13
Appendix.................................................................................15
Introduction
I am a financial advisor for CambsTec Ltd. I shall be producing a report for my client, to decide which of two companies they wish to invest £10,000 of their savings into. These two companies which I will be analyzing are Thornbury Plc and Cadflake Plc.
My report will advise and suggest which company I believe is the best investment.
The report will be produced and completed by 21st July 2004 and given to my client to review and consider.
I will also take this advantage of also investigating other potential investment products my client may be interested in.
Table of Findings
In this table of findings, it shows the gross profit margin, net profit margin, return on capital employee and acid test results for both Thornbury Plc and Cadflake Plc in 2002 and 2003.
It clearly shows which company is more successful and sells more products.
Throughout 2002 and 2003 Thornburys Plc figures are much higher than Cadflake Plc.
The following data in this table has been gathered from both companies summary directors report, and the figures were then used to calculate the following information.
Cadflake Plc
Thornbury Plc
2003
2002
2003
2002
Gross Profit Margin
42.8%
43.5%
46.7%
47.3%
Net Profit Margin
6.4%
7.4%
20.1%
8.9%
R.O.C.E
7.6%
8.6%
1.6%
0.1%
Current Ratio
.8:1
.5:1
2.1:1
2.1:1
Acid Test
0.8:1
0.7:1
.1:1
.2:1
Profitability Analysis
Gross Profit Margin
Gross profit margin (GPM) is the total profit made in a year as a percentage of sales; it can also be defined as the difference between the value of stock sold (sales) and the cost of producing the sales.
GPM measures what percentage of turnover is represented by gross profit - how many pence out of every £1 sale is gross profit.
The gross profit calculation can be found in a company's trading profit and loss account, it is calculated using the following formula, and it will give you a percentage.
Gross profit
x 100
Turn over
(Gross profit divided by turn over multiplied by 100 for a percentage)
Turnover is sometimes referred as sales revenue; it is the amount of money that the business receives from selling its product.
The higher the GPM the better, this is because it increases the gross profit figures and income the company receives. It is also helpful for those interested in how well the business is doing, for example creditors, this will let them know it the business profits are enough to repay loans.
During 2002 the gross profit margin figures for Cadflake Plc was 43.52% this means that for every £1 earned in turnover so £43.52 was gross profit, However in 2003 the gross profit margin was 42.87% the profit was £42.87. Therefore the figures from 2002 - 2003 decreased by 0.65% this may be due to a increase in products price which allowed consumers to become disloyal and switch product brands as there is continuous competition in the saturated market. Lastly standards maybe lacking in each product.
During 2002 the gross profit margin for Thornbury Plc was 46.7% the gross profit made was £46.70 however in 2003 the gross profit margin was 47.7% the profit earned in turn over was £47.70.
The figures here increased positively by 0.53% this may be due to a decrease in products price or the quality and standards may be improved. Also the business may have reduced waste, as well as lowering costs for other uses such as advertising, petty cash, lighting, heating, office expenses and wages.
In conclusion there is a difference between the gross profit margin of both companies, Thornbury Plc has been proved to have an improving gross profit margin during 2002, Thornburys gross profit margin was 3.2% higher than Cadflake Plc.
In 2003 the difference of both ...
This is a preview of the whole essay
The figures here increased positively by 0.53% this may be due to a decrease in products price or the quality and standards may be improved. Also the business may have reduced waste, as well as lowering costs for other uses such as advertising, petty cash, lighting, heating, office expenses and wages.
In conclusion there is a difference between the gross profit margin of both companies, Thornbury Plc has been proved to have an improving gross profit margin during 2002, Thornburys gross profit margin was 3.2% higher than Cadflake Plc.
In 2003 the difference of both companies was 4.5% once again Thornbury Plc was much higher than Cadflakes Plc.
Both Cadflakes and Thornburys Plc can improve their gross profit margin by increasing the price of their products; this will lead to an increase in their gross profit. However this may lead to a decrease in sales as some consumers may not be prepared to purchase products, which prices have been increased but then again both quality and standards of the product may be worth a higher price to purchase at.
The companies could also reduce wastes, by either recycling or cutting down on uses such as electricity for example, not leaving the light on in an unused room; these minor differences may have a large impact on the company's gross profit.
In my opinion I think the companies could either decrease the price of their products as well as the quality just slightly, however consumers may switch to another brand.
Both Cadflakes and Thornburys could also consider increasing the prices of their products as the quality will be very good and consumers will be satisfied and prepared to buy the product, however once again consumers may change to another brand as there is a lot of rivalry in the saturated market.
Lastly by introducing a new and unique product, which is of excellent quality at a higher price, may once again attract more consumers, which will lead to an increase in the gross profit margin.
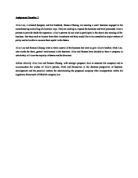
FIGURE 1. Quality Sold
This graph shows the relationship between demand and price of products when the price has changed.
If the quality of the product falls the graphs demand curve will shift depending on the demand of the product.
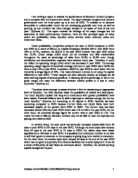
Price
Quantity sold FIGURE 2.
This graph shows that if the demand falls, the demand curve will shift to the left, however if the demand increases the demand curve will shift to the right.
Net Profit Margin
Net profit margin (NPM) is the profit you have left after paying all other costs.
It measures the amount you personally keep after deductions for the business have been taken.
It is calculated using the following formula.
Net profit
x 100
Sales turnover
It is calculated by net profit divided by sales turnover/revenue then multiplied by 100; this will give you a percentage.
The higher the net profit margin the better, this is because it shows how well your company is doing and is your own personal wages are of good standards.
Also, repaying creditors may not be a problem as your businesses credit history will be good and you won't receive any financial problems in the near future.
During 2002 the net profit margin for Cadflakes Plc was 17.4% however in 2003 the net profit margin was 16.4%
Therefore figures have decreased from 2002-2003 by 1% this may be due to products lacking customer's satisfaction, and quality; also a variety of different chocolates may attract more consumers to different brands in the saturated market.
During 2002 the net profit for Thornburys Plc was 18.9% however in 2003 the net profit margin was 20.1%
Therefore figures increased successfully by 1.2%
Overall in 2002 Thornburys did 1.5% better than Cadflake Plc, however once again in 2003 Thornburys Plc did 3.7% better than Cadflakes.
In conclusion both companies can improve their net profit margin by careful use of money.
By lowering the employee's wages slightly may make a huge difference within the company.
Also once again reducing waste by recycling, lighting, heating, office expenses, petty cash and lastly to try and find a cheaper insurance company.
In my opinion I think the companies could improve and increase their net profit margin if they reduced overhead costs slightly to save money.
Return on Capital Employed
Return on capital employed is the total profit made by a company as a percentage of the total capital used in the business; it is how much profit is made for every £1 invested within the company.
The amount the owners earn in the capital used in the business is normally measured by the return on capital employed ratio.
Return on capital employed is calculated using the following formula,
Net Profit (year)
x 100
Capital Employed (net assets)
(Net profit divided by capital employed multiplied by 100)
This is the most important ratio in which an investor would be concerned and interested to look for.
Investors may look at the return on capital employed of several companies to see where they can get the best investment or return.
The return on capital employed is the fixed assets plus net current assets subtracting any borrowings which must be repaid over a certain period of time, generally one year.
The higher the return on capital employed the better the investment will be. If the ROCE is increasing the business is becoming more profitable.
However, if the return on capital employed is decreasing, investors expect managers to find ways in which the company can improve.
During 2002 the return on capital employed for Cadflake Plc was 8.6% although in 2003 the return on capital employed was 7.6% therefore the figures from 2002-2003 decreased by 1%
Throughout 2002 the return on capital employed for Thornbury Plc was 10.1% however in 2003 the ROCE was 11.6% therefore the figures from 2002-2003 increased by 1.5%
Both companies can improve there return on capital employed by considering different strategies in which to increase there gross profit margin, net profit margin and by reducing the number of current assets.
If the companies were to try lowering the prices of there product this may however lead to poor quality in this product.
Liquidity Analysis
Liquidity measures whether or not a firm has enough sufficient resources available to pay off its debts, as they are due, liquidity ratios measure how much money the firm has.
The faster and easier a firm can change its assets into cash the more liquid it is.
A company will be put into liquidation i.e. bankrupt if they do not have enough current assets - stock, cash and debtors to cover the current liabilities, this is a debt that must be paid within a short period of time often up to 6 months.
Current Ratio
The current ratio is also referred as the working capital ratio; it is defined as the ratio of current assets over current liabilities. Current assets are either recognized in the form of cash or stock, which will be turned into cash it includes stocks of finished goods, debtors and cash.
The current ratio matches current assets (CA) with current liabilities (CL)
It is calculated using the following formula:
Current Assets (CA)
Current Liabilities (CL)
(Current assets divided by current liabilities)
It shows whether or not a firm is capable to pay of its short-term debts and also how much money the company owns in current assets, it is important the company maintains a balanced ratio.
There is no specific current ratio however an average of 2:1 is acceptable and also between 1:5 and 2:5 is satisfactory.
If the company's current ratio is increasing, this may mean that the companies stocks are too high, it has to many debtors (the business owes money to) or lastly it has too much money and profit.
If the ratio is below 1 it is unlikely the company is able to pay of their debts, however if the ratio is above 1 the company has enough money and profit.
During 2002 the current ratio for Cadflake Plc was 1:5:1 however in 2003 the current ratio was 1:8:1 therefore figures have increased by 0.29 this maybe due to a decrease in their current liabilities or an increase in their current assets.
During 2002 the current ratio for Thornbury Plc was 2:1:1 however in 2003 the current ratio was 2:1:1 in both 2002 and 2003 Thornbury Plc's current ratio was balanced and 0.30 superior than Cadflake Plc.
Both Cadflake Plc and Thornbury Plc can improve their current ratios by increasing their current assets it will allow them to reduce the amount of stock that is held within the business.
Also both companies should consider giving less credit this will improve their current liability and lastly the current ratio may also be improved if companies encouraged debtors to pay instantly or as soon as possible.
In conclusion Thornbury Plc's current ratio for both years was balanced and acceptable, they should try and maintain these figures and not allow it to decrease.
However Cadflake Plc should aim to increase and improve their current ratio figures, this maybe by reducing stock or reducing the amount of debtors, in 2002 £2003000 was owed to them, and in 2003 £1900000 was owed to them.
Acid Test Ratio
Acid test ratio could also be referred as liquid capital ratio; it is a measure of the money which a business has already available to may off its debts rapidly.
However, this does not include stock, this is due to the fact that stock is the least liquid of the current assets, this means that it can take a period of time to change stock into money.
It is calculated using the following formula:
Current Assets (CA) - stock
Current Liabilities (CL)
(Current assets subtract stock and then divided by current liabilities)
The acid test ratio shows the balance between both liquid assets and the current liabilities, preferably the acid test ratio should be a balanced 1:1 this indicates that a firm has just enough current assets to meet its current liabilities, if the acid test ratio is above 1 this shows a business has enough money.
During 2002 the acid test ratio for Cadflake Plc was 0:7:1 however in 2003 the acid test ratio was 0:8:1 therefore figures have increased by 0:1:1 this shows progress within a year.
During 2002 the acid test ratio for Thornbury Plc was 1:2:1 however in 2003 the acid test ratio was 1:1:1 therefore figures have decreased by 0:1:1 in both 2002 and 2003 Cadflakes Plc's current ratio had increased.
In order for both Cadflake Plc and Thornbury Plc to improve their acid test ratio, the business may use similar strategies as used to improve their current ratio. These could include reducing the amount of stock held, as well as encouraging debtors to pay sooner and lastly to give less credit. This will allow a steady increase in current assets and current liabilities.
In conclusion both Cadflake Plc and Thornbury Plc should consider reducing stocks to try and improve their acid test ratio, this however maybe quite difficult because it is difficult for a company to reduce their stock by changing it into cash, this is due to the fact it is less liquid.
Conclusion
In conclusion I believe that from my findings and evaluation it is clear that Thornbury Plc throughout 2002 and 2003 has been more successful and efficient company to invest your savings into.
Thornbury Plc has consistently high and increasing figures in gross profit margin, net profit margin, return on capital employed, and there was a balanced ratio of both current ratio acid test ratio.
During 2002 Thornbury Plc's gross profit margin was 3.2% higher than Cadflake Plc; however in 2003 Thornbury Plc's gross profit margin was 4.5% higher than Cadflake Plc.
Secondly during 2002 Thornbury Plc's net profit margin was 1.5% higher than Cadflake Plc; however in 2003 Thornbury Plc's net profit margin was 3.7% higher than Cadflake Plc
Lastly in 2002 Thornbury Plc's return on capital employed was 1.5% higher than Cadflake Plc; however in 2003 Thornbury Plc's return on capital employed was 4% higher than Cadflake Plc.
Overall Thornbury Plc continues to grow in strength, their profits and turnover have both increased positively over the previous year, and this is why I advise my client to invest their savings into Thornbury Plc.
However, it would be ideal to consider the negative points, although Thornbury Plc's profits continue to grow it is not certain that consumers will continue buying this specific chocolate as new companies and chocolates are developing and consumers are now beginning to become health conscious.
Furthermore, I haven't got any personal information on my client but I will however consider the risks for different age groups and what will ideal for them.
An old age pensioner (OAP) must consider that by investing all £10,000 of their savings into a company, there may be a risk of loosing all their savings, and for a senior person stress should not be an issue and their only type of income is there pension.
A younger investor however may also consider the same facts; if they invest all there savings into a company there may be a chance the businesses profits and figures may begin to fall and all their savings may just go to waste. The young investor may than find the need to reclaim that money after years of working hard.
Overall I personally suggest it is ideal to place half your savings into the bank and invest the other £5,000 into a company with increasingly good figures, preferably Thornbury Plc.
If for instance you don't get enough shares in return, you wont loose all your savings because the money you have put into the bank will not have been touched whilst the other half is at risk you'll definitely half £5,000 left in the bank secure.
Although I have only two companies director reports to analyse, the figures are 2 years old and therefore both companies Thornbury Plc and Cadflake Plc may have dramatically improved or decreased in profits.
Also you cannot be certain if the companies are currently in a better or worse position.
Lastly an issue to consider is the fact that consumers are now becoming more health conscious, and this may affect the chocolate market in the future and also affect the amount of shares you receive.
Also there are many different competitors in this market and the rivalry may also affect the business you invested in profits, there is no certain fact that these companies have financial stability.
In conclusion I believe you should place half of your savings into the bank and invest the other £5,000 into Thornbury Plc however I strongly suggest you gather more deeper and recent information and figures of this company.
Although Thornbury Plc has been growing in strength there is a lot of competition and failures in this market.
Appendix
Profitability
Gross Profit Margin (GPM)
Gross Profit
X 100
Turnover
This shows gross profit as a percentage of sales. A business would want to maintain or increase this percentage.
Cadflake Plc
2002
2258 / 5189 x 100 = 43.5%
2003
2247 / 5242 x 100 = 42.8%
Thornbury Plc
2002
890 / 1904 x 100 = 47.3%
2003
003 / 2122 x 100 = 46.7%
Net Profit Margin (NPM)
Net Profit
X 100
Turnover
This shows gross profit as a percentage of sales. Again a business would want to maintain or increase this percentage.
Cadflake Plc
2002
905 / 5189 x 100 = 17.4%
2003
862 / 5242 x 100 = 16.4%
Thornbury Plc
2002
361 / 1904 x 100 = 18.9%
2003
427 / 2122 x 100 = 20.1%
Return On Capital Employed (ROCE)
Net Profit
X 100
Capital Employed
This shows the percentage rate of return for the owner's investment.
Cadflake Plc
2002
905 / 10557 x 100 = 8.6%
2003
862 / 11350 x 100 = 7.6%
Thornbury Plc
2002
361 / 3573 x 100 = 10.1%
2003
427 / 3669 x 100 = 11.6%
Liquidity
Current Ratio
Current Assets
Current Liabilities
This shows whether a business can pay of its short term debts. Current assets should be greater than current liabilities.
Cadflake Plc
2002
5310 / 3363 = 1:5:1
2003
5277 / 2823 = 1:8:1
Thornbury Plc
2002
2397 / 1102 = 2:1:1
2003
2420 / 1115 = 2:1:1
Acid Test Ratio
Current assets - stock
Current liabilities
This shows whether a business can pay its short term debts without selling any stock. This is important as a business may not be able to sell stock quickly.
Cadflake Plc
2002
5310 - 2894 / 3363 = 0:7:1
2003
5277 - 2950 / 2823 = 0:8:1
Thornbury Plc
2002
2397 - 1156 / 1102 = 1:2:1
2003
2420 - 1182 / 1115 = 1:1:1
Mandip Rai
0 Green
GCSE Business Studies
Task 1
GCSE Business Studies
Candidate number - 13130