The graph (Figure 1.0) shows what an analogue signal would look like scratching onto the tin cylinder can! The machine which records it is called Edison's phonograph.
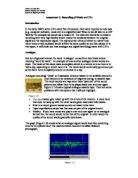
Instead of noting it down on a cylinder can, we can do it electronically! You can see an example of this on Figure 1.2 below. The graph is showing the position of the microphone diaphragm (Y axis) over time (X axis). The diaphragm is vibrating on the order of 1,000 oscillations per second. You can see that the vibrations that are noting down the sound are working very quickly! Even saying a hard like “hello” has a particular tone! The graph is showing it going up and down which resulted 500-hertz (500 oscillations per second) wave.
Digital Data
The word digital in Latin means “digitus” or “finger,” because everyone from an early age learns to count on his/her fingers. We have ten fingers, so with us humans, the common numbering system is to the base 10 (0 to 9). For computers, they use ‘0’ and ‘1’ because they don’t have fingers! Usually ‘0’ is off and ‘1’ is on. This is what we call the binary system. With digital recordings, the computer uses the binary coding system to decode and encode.
An example: How does it work?
We can take a painting for example, if oil was spilled on the painting it is complex to restore what was there before because the oil has become part of the painting. However if someone recorded the painting with a “paint-by-number” scheme in great detail, the oil wouldn’t matter there no numbers assigned to the oil! The artist could redraw the painting by following the number codes exactly. Only this time the oil spillage wouldn’t be there! Identical copies can be made from here. Digital data works exactly like this which is why it can reproduce what it had originally just by using numbers.
Digital recordings can that avoids the disadvantages that analogue get. It does not try to draw the information that is being saved. As an alternative, it converts the information into a mathematical code that ignores the flaws of whatever ‘medium’ (The carrier between a source of information and its intended audience!) is storing the data. Figure 1.3 shows what a CD looks like:
Converting Data
To make output of sound better quality and efficient, we would have to convert an analogue sound into digital before it is outputted! How is this done might you ask? Well digital recording converts the analogue wave into a stream of numbers and records the numbers instead of the wave which we saw on the graph diagrams figures 1.1 and 1.2. The conversion is done by a device called an ‘analogue to-digital converter’ (ADC).
To play back the music, the stream of numbers is converted back to an analogue waves by a ‘digital-to-analogue converter’ (DAC). The analogue wave produced by the DAC is put through an amplifier which produces the sound out through speakers. The sound of a CD would be of the same every time you play it unless for example the numbers that are being converted is corrupted. The analogue wave produced by the DAC will be the same or near enough original analogue waves if the ADC produces accurate numbers and it is sampled at a high rate.
Compact Disk (CD)
When CD's sampling rate and precision is working, it produces a lot of data. On a CD, the digital numbers produced by the ADC are stored as bytes! Just for fact, it takes just two bytes to represent 65,536 gradations. A CD can store up to 74 minutes of music. Therefore the total amount of digital data that must be stored on a CD is! How is this worked out is what you are thinking? Well the equation for this is by:
44,100 samples/ (channel*second) * 2 bytes/sample * 2 channels * 74 minutes * 60 seconds/minute = 783,216,000 bytes
The CD player
The CD player has the job of finding and reading the data stored as bumps on the CD. Considering how small the bumps are, the CD player is very precise when scanning the bumps! A laser and a lens system focus in on and read the bumps.
A tracking mechanism moves the laser assembly so that the laser's beam can follow the spiral track which can move up and down the CD.
Below on Figure 1.4 shows what is inside of a CD player. Some of the components are labelled so it is easier to distinguish what is what!
Regeneration of analogue signals in the CD player
Inside the CD player there is a DAC. Inside of the DAC, there is a clock that regenerates the digital data stream of the CD-player. Regeneration is done by something called Phase Locked Loop (PLL) which is located in the input receiver. However in this DAC design an additional PLL is applied between the input receiver and the DA converters. A disadvantage is the PLL has a very slow tracking of frequency changes but it is acceptable because the data stream is generated with very stable X-tal oscillator inside the CD-player.
The PLL exists of a Voltage Controlled X-tal Oscillator (VCXO) which is compared with the regenerated clock from the input receiver. This 'error signal', filtered with a low pass filter with a very low bandwidth (far below the audio range), controls the VCXO. However, the unfiltered 'error signal' is available as an output. We called this output PLL sound.
With an ideal CD-player and ideal PLL this signal should be a constant voltage. However after measurement and listening we would know better. At the output a very small signal is present with noise and signal that is some how parallel with the analogue music signal.
By connecting an amplifier with high gain to this output, differences between different players could be detected. It is even possible to determine differences between the original CD and several CD-ROM copies (the brand as well as writing speed). There is a link between the sound quality of the CD-player (used as data source only for the DAC) and the signal at the PLL sound output. This feature makes it possible for the DAC owner to listen to the 'quality' of the CD-player and possibly to improve it. The PLL sound output is something like a subjective clock spectrum analyser.
Conclusion
Over the years, technology has moved very rapidly especially with the recording of music as a digital signal on a CD and the way analogue signal is regenerated on a CD player. Today most would listen to a digital form of music but the processes still involve analogue signals along the way! Here we have showed that although just playing a CD could be as easy as pressing the ‘Play’ button, the logic and processes are somewhat unknown to many! At the end of the day these advances would only make listening to music more enjoyable for people.