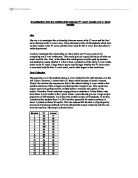
There are 93 teams in total, 20 in the premier division and 24 in divisions 1,2 and 3. In a stratified sample of 50 teams, this equates to 11 teams from the premier division and 13 from each of the other 3 divisions. Within the 4 strata, the teams will be selected entirely at random using a random number generator.
Using a stratified sample, I have selected the following teams to study.
Premier Division – Aston Villa, Coventry City, Everton, Leicester City, Liverpool, Manchester Utd, Newcastle Utd, Nottingham Forest, Tottenham, West Ham Utd & Wimbledon.
Division 1 – Barnsley, Birmingham City, Bradford City, Bristol City, Grimsby Town, Norwich City, Port Vale, Portsmouth, Sheffield Utd, Stockport County, Sunderland, Watford & WBA.
Division 2 – Blackpool, Bournemouth, Bristol Rovers, Colchester Utd, Gillingham, Luton, Millwall, Northampton Town, Oldham Athletic, Preston N.E., Wigan Athletic, Wrexham & York City.
Division 3 – Barnet, Brentford, Cambridge Utd, Chester City, Darlington, Exeter City, Halifax Town, Hartlepool Utd, Hull City, Plymouth A, Rochdale, Southend Utd & Torquay Utd.
I am happy that this sample is a fair sample as it is stratified and I expect it to give a good representation of the situation as a whole.
I will use my sampled data to compare the amount of money a club receives with my 3 measures of ‘success’, league position, goal difference and stadium capacity.
I think it will be useful to use two methods, to compare the quantities. One such method is scatter graphs. I will draw 3 scatter graphs to investigate the correlation between money received and league position, goal difference and stadium capacity. This will be useful as it will make it easy to see if the 2 factors are linked. Another method I will use is to split the sampled teams into groups according to how much money they receive and find the standard deviation of the league position, goal difference and stadium capacity within each group. This is useful as one would expect that clubs that receive similar amounts of money would have similar levels of success and thus a low standard deviation of success measuring quantities. Using standard deviation, I will be able to show whether this is the case.
One problem of using league position that I can foresee is the fact that there is not the same number of teams in all for divisions. This is a problem because it makes the results of plotting a scatter graph misleading. If a scatter graph is plotted of money Vs. league position, problems could arise. For example, a team finishing 20th in Division 1 (24 teams) is more successful than a team finishing 20th in the Premier Division (20 teams). This could not be shown on a graph of money Vs. league position. A way to remedy this problem is to represent league position as a percentage (e.g. last in league = 100%, 10th in league of 20 = 50%, 12th in league of 24 = 50%).
Investigating how money affects league position
A scatter graph of football trust grant vs. % league position was plotted:
It would appear that there in no correlation between the two factors. Separate graphs for teams from each division were plotted however these also suggested no correlation.
The data was grouped according to how much money the club receives. The standard deviation of each group was then calculated. Generally a group will be of size £500,000 however, for the groups 2.5M – 3M and 3M – 3.5M, there is only one team in each group. Therefore it is impossible to calculate the standard deviation.
As standard deviation is calculated by
the maximum possible value for the standard deviation of % league position within a group is 50 as percentages are numbers between 0 and 100.
I expected the standard deviations within each group to be low (i.e. low compared to a maximum value of 50). This is not the case. This shows that there is great variation in the league position of teams within each group and that teams which receive similar grants do not finish in similar league positions.
Both methods which I have used suggest that there is no link between football trust grant and league position. Evidence for this is the fact that there is no correlation between the two on the scatter graph and the fact that standard deviation has shown that teams which receive similar grants do not finish in similar league positions. This provides a strong argument that my hypothesis, the more money a football club receives the higher its league position was incorrect.
Investigating how money affects goal difference
A scatter graph of football trust grant vs. goal difference was plotted:
Again, it would appear that there is no correlation between the two factors.
Again, standard deviation was applied to the grouped data. The results were as follows:
The standard deviations are not particularly low. This shows that within each group, there is great variation in goal difference. The slight exception to this is the 500k – 1M group where there is less variation. However, in general, these results show that teams which receive similar grants do not have similar goal differences.
Both methods which I have used suggest that there is basically no link between football trust grant and goal difference. Evidence for this is the fact that there is no correlation between the two on the scatter graph and the fact that standard deviation has shown that teams which receive similar grants do not have similar goal differences. This provides a strong argument that my hypothesis, the more money a football club receives the greater its goal difference was incorrect.
Investigating how money affects stadium capacity
A scatter graph of football trust grant vs. stadium capacity was plotted:
It would appear that there is a weak positive correlation between the 2 factors. A line of best fit has been added. To verify that this line is accurate, I will check that it passes through the point (x,y). This point has been found to be (1155200,19072). This graph shows that in general, the greater the grant, the greater the stadium capacity.
Again, standard deviation was applied to the grouped data. The results were as follows:
Stadium capacities are relatively large numbers therefore these standard deviations are quite low. Looking at the data, it is clear that these standard deviations would be considerably lower were it not for the odd extreme value within the groups. These values show that within each group there is not a great amount of variation in stadium capacity and that teams with receive similar grants have fairly similar stadium capacities.
Both methods which I have used suggest that there is a link between football trust grant and stadium capacity. Evidence for this is the fact that there is a weak positive correlation between the two on the scatter graph and the fact that standard deviation has shown that teams which receive similar grants have fairly similar stadium capacities. This provides a strong argument that my hypothesis, the more money a football club receives the greater its stadium capacity. was basically correct.
I began the investigation with three sub hypotheses which made up the overall hypothesis that the more money a football club receives the more successful it is on the pitch. I have disproved 2 of there hypotheses and proved 1. Thus, it is difficult to say whether my main hypothesis was correct or not. However as already mentioned, it is questionable whether stadium capacity is as significant a factor than league position or goal difference as, for example, a successful and well-supported team could play in a very small stadium if the stadium was in a built up area where there was no space to enlarge it. If one discounts the stadium capacity as less significant, it is possible to state that my main hypothesis was disproved and that ‘the more money a football club receives the more successful it is on the pitch’ is not the case.
One reason which might explain the results of my investigation (money affects stadium capacity but not league position or goal difference) is that the clubs may be spending their grant money on ground improvements rather than players or coaches.
One way to improve the investigation to see how money affects the success of a football club would be to acquire the statistics for the total income of a football club as opposed to just the football trust grant. For this, it would be necessary to acquire statistics for all other sources of a football club’s income such as income from ticket sales and merchandising.
DATA