
"Males in the 11-18years age range will guess the angles and lengths better than females in the 30+years age range."
INTRODUCTION: We have been given a task to work with the statistical side of maths. We were told that a random sample of one hundred and fifty people were asked to estimate the degree of an angle which looked like this: Also each person was asked to estimate the length of a line which looked something like this: From this we were asked to think about what sort of conclusions we could give for the analysed results. I thought about this and came up with the following hypothesis: "Males in the 11-18years age range will guess the angles and lengths better than females in the 30+years age range." I have chosen this hypothesis because it allows me to look at both age and gender of the surveyed people. (The actual measurement of the angle was 36.5degrees and the actual measurement of the line was 4.35cm) The data I have received from the survey is on the following page... PLAN: To investigate this hypothesis I may need to use a number of methods to calculate the data I will receive. I may need to use many statistical tools which I already know; such as Averages, Standard Deviation, Frequency Polygons, Histograms, Scatter Diagrams, Cumulative frequency and maybe other methods which I will have to research. As the sample I am being given is random, it has a large range of varied aged males and varied aged females. I need to divide the groups up into the groups I have to

I chose to investigate the relationship between the height and weight of year 7 students. I think that as the height increases, so will the weight.
Jenny Hodgson 11A Maths Statistics Coursework Hypothesis I chose to investigate the relationship between the height and weight of year 7 students. I think that as the height increases, so will the weight. This means there would be a positive correlation. I think that the correlation coefficient will be between 0.5 and 1 because that is strong positive correlation. -1 0 1 negative no positive correlation correlation correlation Method To investigate my hypothesis, I used given data from Mayfield High School. It contained information such as name, age, height, weight, IQ, eye colour, hair colour etc. Using a computer, I opened the data using Microsoft Excel. As I was only investigating height and weight of year 7 students, I deleted all the irrelevant columns, such as year 8, 9, 10, 11 students, IQ, hair colour, eye colour etc. I then sorted the data, again using the computer. I discarded my outliers in the data. I discarded data which either had very tall or very heavy people on and this may be false data, unreliable and affect my final result. I needed a sample of 50 students and I had 200 year 7 students. To get my sample of 50 students, I used

I am going to estimate the population of woodlice in parts of the school ground, using Lincoln Index.
ESTIMATING THE POPULATION OF WOODLICE IN PARTS OF THE SCHOOL GROUND Aim: - I am going to estimate the population of woodlice in parts of the school ground, using Lincoln Index. Materials White trays, gloves, nail polish and spoon. This investigation would be performed, using the mark-release recapture technique. Method A certain area is marked out and then by lifting up stones and pieces of decaying wood, woodlice found are picked up by using a spoon and placed in a white tray. The amount of woodlice caught is counted and then each woodlouse is marked with the nail polish in such a way that will not harm them or attract predators. The woodlice are then released into their habitat and allowed to mix with the rest of the population. After two days, woodlice are then caught from the same location and the amount caught is recorded, along with the number of the woodlice that have already been marked from the first sample. Result Number of Woodlice Original sample, S1 35 Second sample, S2 39 Number marked in second sample, m 2 Lincoln Index Total population = (S1 x S2)/ m Total population of woodlice = (35 x 39)/ 2 = 682.5 Approximately 683 woodlice are present in this area. This method is reliable if I assume that * The marked woodlouse mix evenly with the unmarked; * Being caught the first time does not increase or decrease the likelihood of the
Factors that most affect the prices of second hand cars
Maths Coursework Hypothesis For my maths project I will hope to find out the factors that most affect the prices of second hand cars. From my preliminary work I have chosen five factors that could possibly affect the prices the most. The five that I have chosen are: . Mileage 2. Age 3. Owners 4. Insurance Group 5. MPG (Miles Per Gallon) Evidently these factors will all be compared to the percentage decrease in price from new to second hand. By the end of the project I will hopefully have found the biggest factor in percentage decrease in price. In this project I will be using several different graphs including correlation coefficient, scatter graphs and histograms. For my scatter graphs I will use the mileage and the miles per gallon compared to the percentage decrease in price. For my correlation coefficient I will be using the age compared to the percentage decrease in price Prediction I predict that the mileage will affect the price of second hand car the most. This is because the mileage determines how much the car has been used and this leads to the quality of the engine. I also think that the number of owners and the age will affect the prices of second hand cars tremendously. I believe that the MPG will effect the prices of second hand cars significantly as the miles per gallon can show the cost of running the cars and if the MPG is high then that might
Statistic: Is reading age a predictor for future attainment?
Statistic: Is reading age a predictor for future attainment? In this coursework I am going to investigate if reading age affects future results in KS3 Maths. I am going to consider gender differences. I believe that girls will make more improvement than boys because girls have a higher reading age than boys; I also predict that reading age will not be a predictor for future attainments. In order to collect my data fairly I am going to take a stratified sample because it will randomly select boys and girls, and won't give me a bias selection. I am going to collect a random sample by using my calculator and the random button. I pressed in the number of girls and boys (96 for girls, 143 for boys) I then pressed the random button which gave me numbers between 0 and the number of boys and girls which I then take down and draw up a table from it. I am going to present my data using the following statistical techniques a cumulative frequency diagram so it can show both discrete and continues data. Scatter diagrams, I can use that to show whether two sets of data are related. Box & Whisker plot of reading ages, mode, mean, median, and range, IQR to show me how the data is distributed. I will then do the same for the boys and girls. This will tell me which genders achieving well depending on their reading age. To summarise the KS3 Maths data I will use Bar charts, Pie charts mean,

This is an investigation to identify some compounds containing oxygen AimThis experiment is to identify the chemical by use of their functional group in simple reactions
This is an investigation to identify some compounds containing oxygen Aim This experiment is to identify the chemical by use of their functional group in simple reactions. With the information that all the compound contain 3 carbon atoms, 6 or 8 hydrogen atoms, 1 or 2 oxygen atoms and no other elements simple tests can be performed which will identify the functional group of the compound and the name of the compound can be deduced from this information. I have chosen to use: * Propanoic acid * Propanal * Propanone * Propan-1-ol * Propan-2-ol * Methyl ethanoate I will identify the compound following the flowchart below Tollens reagent (ammoniacal silver nitrate) reduces the to a carboxylic acid, the complex silver nitrate is reduced to metallic silver which adheres to the surface of the test tube forming a mirror effect. 2,4-dinitrophenylhydrazine is a yellow solid which when dissolved in methanol and acidified with sulphuric acid it is able to react with the keytone to form a condensation product. The precipitate can be filtered off and the melting point determined. CH3COCH3 + C6H3(NO2)2N2H3 C6H3(NO2)2NHN=C(CH3)2 +H2O Warm acidified dichromate oxidises alcohols, primary alcohols are oxidised to an aldehyde then to a carboxylic acid if there is enough dichromate to oxidise the aldehyde, so if the Tollens reagent is added the aldehyde is
My hypothesis is: 'Girls obtain better grades than boys'.
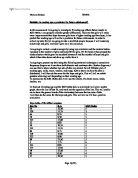
Sampling Data I am choosing a pupil to represent our school by their grades; I need to find out which sex obtains better grades so I can make my choice. My hypothesis is: 'Girls obtain better grades than boys' I have been given some data of some student's CATs and SATs results and by taking different types of samples of the data I will find out if girls obtain better grades than boys. Sampling There are four different types of sampling that can be used. These are: Systematic Sampling This is where there is a systematic way of choosing the sample, e.g. every 10th item will be sampled. Attribute Sampling This is where a sample is taken by choosing the sample by using unrelated attribute, e.g. to sample every person who's birthday is in the first two months. Stratified Sampling This is where a sample is taken according to what the population consists of, e.g. if there is 200 girls and 100 boys in the population then in your sample take 20 girls and 10 boys. Random sampling This is when a sample is taken at random, this means that every data item is likely to be chosen. I have chosen to do random sampling; this is because it was the most appropriate. I tried systematic sampling and here were my results: Males Females 81 82 91 84 94 88 96 92 98 98 01 00 03 14 04 16 06 18 07 13 18 Males Females Mean = 102 Mean = 101 Median = 102 Median
An investigation into the density of 'mock blood'
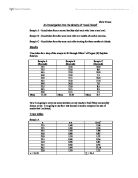
Chris Ellison An investigation into the density of 'mock blood' Sample A - blood taken from a normal healthy adult male who lives at sea level. Sample B - blood taken from the same male after six months of aerobic exercise. Sample C - blood taken from the same male after training for three months at altitude. Results Time taken for a drop of the sample to fall through 100cm3 of Copper (II) Sulphate Solution. Sample A (Seconds) Sample B (Seconds) Sample C (Seconds) 1.5 2.0 0.0 1.5 3.0 8.0 4.5 2.0 0.0 4.0 2.0 7.5 2.0 3.5 0.0 2.5 4.0 1.0 4.0 6.0 7.0 2.5 2.0 8.5 6.5 4.5 9.5 2.0 1.5 7.5 Mean 13.10 Mean 13.05 Mean 8.5 Now I am going to carry out some statistics on my results to find if they occurred by chance or not. I am going to use the t-test because I need to compare two sets of results that I collected. T-test tables Sample A x x-x (x-x)2 1.5 .60 2.56 1.5 .60 2.56 4.5 .40 .96 4.0 0.90 0.81 2.0 .10 .21 2.5 0.60 0.36 4.0 0.90 0.81 2.5 0.60 0.36 6.5 3.40 1.56 2.0 .10 .21 x = 13.10 ? = 23.4 Sample B x x-x (x-x)2 2.0 .05 .10 3.0 0.05 0.30 2.0 .05 .10 2.0 .05 .10 3.5 0.45 0.20 4.0 .05 .10 6.0 2.95 8.70 2.0 .05 .10 4.5 .45 2.10 1.5 .45 2.10 x = 13.05 ? = 18.63 Sample C x x-x (x-x)2 0.0 .10 .21 8.0 0.90 3.61 0.0 .10 .21 7.5
Which three factors affect the price of a second hand car.
Used Car Prices: Coursework Aim The aim of this project is to decide which three factors affect the price of a second hand car. I will choose the three factors, which I think, will influence the price the most out of several lines of enquiry. Introduction I plan to investigate what factors influence the price of a second hand car. To begin with I had to look at a database of 100 cars. This database gave me a lot of information about each car (e.g. age, air con, mileage etc). All these factors were my lines of enquiry. To choose my three factors I had to decide which three of the eighteen factors would affect the price the most. Lines Of Enquiry There are a few lines of enquiries, which could be possible factors in affecting a second hand cars price. To choose my three factors I put all the lines of enquiry into a list from most important (1) to least important (18) . Mileage - This is my top factor because it tells you exactly how long the car has left in it. If the mileage is high it means the car has traveled far and may be in need of repair. 2. Age - This tells you how long the car has been running, if it's been running a long time its parts may be worn from the rust and may need a repair. 3. Engine Size - Many people want a large engine, this may be because they want to go fast or maybe they live up a hill and want to make sure that it can go up without much
Guessing the length of a line
Introduction Most people appear to think that the older you are the smarter you are. I am going to investigate this by looking gat data from year 7 and comparing it to data from year 11. Both year groups were asked to complete the same task, to guess the size Hypothesis . Pupils in year 11 are better at guessing the length of a line than pupils in year 7. 2. People who are good at estimating lengths are good at estimating angles. For both of my hypothesis I am going to be using secondary data given to me by my school, as this is less time consuming than collecting data by myself. My sampling frame will be the results from all the girls in School from year 7 to year 11 in 2002 that completed the task. I could take a census survey meaning that I could use every piece of data, which would be more accurate, but would also be immensely time consuming so I am going to take a sample of data. I could also do cluster sampling but this would be too time consuming and inappropriate for my data. It wouldn't give me a large enough sample and therefore wouldn't be in proportion to my data. Once I have collected my sample I am going to use mean, mode, median nd standard deviation to analyse the spread of data. For my first hypothesis I am going to use stem and leaf diagrams and histograms to analyse my data whereas, for my second hypothesis I am going to use scatter graphs to