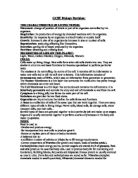
METHOD:
-Materials:
- 20 identical, 250 mL plastic cups
- 5 large 1L plastic jugs
- Marker pen
- 5L of distilled water
- Measuring Cylinder
- Digital Scales
- Aquarium pH test kit including;
- PH indicator (bromothymol blue)
- 100g of pH down (sodium phosphate)
- 100g of pH up (sodium bicarbonate)
- PH colour chart
- Small clear 5ml container
- 20 x 15cm tall plant cuttings from a white perennial geranium plant. Cuttings must be from the same plant with similar stem thickness, and same amount of leaves.
- Secateurs
- Gloves
- Ruler
-
With a marker pen, label 4 cups pH 6.4, 4 cups ph 6.6, 4 cups Neutral, 4 cups pH 7.4 and the remaining 4 cups pH 7.6. Place the cups into four grouped rows and then assign each of the cups from each pH group a number from 1-4, again labeling with the marker pen.
- Fill 5 1L water jugs with 800mL of distilled water and label the jugs; 6.4, 6.6, Neutral, 7.4 and 7.6. (used to fill corresponding cups).
- Test the pH of all 5 water jugs using a sample of the water collected in a small 5ml clear container. Add 3 drops of bromothymol blue and determine the pH of water using the provided pH colour chart. Add sodium phosphate or sodium bicarbonate in 2 gram measurements to achieve desired pH in accordance with labels. Continue to test the pH of the jugs throughout, leaving an hour between each test to ensure the dispersing of chemicals.
- Once each jug has reached its assigned pH level, take one jug and fill corresponding cups with 150ml of the water. Repeat this for each pH group, washing the measuring cylinder between uses, to prevent altering the set pH levels.
- Place cups under an outdoor shelter, where all cups will receive equal sun exposure, and will be protected from rain, hail and frost etc.
-
Use gloves and secateurs to take 20 cuttings from the white perennial geranium. Take cuttings from only one plant to ensure that they share the same genotype. Cut stems 15cm from the base of the leaf at a 45° angle. Ensure all cuttings have similar, if not the same stem thickness. Do not choose cuttings with discolouration to the stem or leaves, and avoid cuttings with more than one leaf, or oversize leaves.
- Place one cutting in each of the 20 cups.
- Record any changes to the plant over six weeks, once a week and document root growth.
VARIABLES:
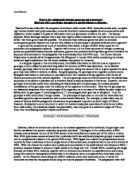
The phenotype of a plant may be influenced by a number of environmental factors. Therefore, in order to demonstrate the effect of different pH on phenotype it was necessary to control various other environmental conditions between the plant specimens, to ensure the validity and reliability of data. Evidently, the independent variable was pH and in order to ensure that this was the factor causing a change in root growth; the dependant variable, it was necessary to develop strategies to keep other variables constant.
- Water Availability: All specimens were grown in 15 cm high plastic cups containing exactly 130 ml each. Water was measured in a measuring cylinder to eliminate variation in water mass. The plants were located under an outdoor roof to prevent rainwater from altering the amount of water in each cup.
- Salt Concentration and Nutrient Availability: The water used to accommodate all 20 plant specimens was tank water. There was, therefore no added nutrients to any off the cups, and any present salts or nutrients were kept uniform between all specimens.
- Light Availability: All specimens were located together in a partial shade area, receiving sunlight in the mornings. Further objects that could have blocked light to any individual plant were removed, to prevent variation in levels of photosynthesis, that would in turn impact on root growth.
- Air Temperature: Temperature between the individual plants was not varied as they were all located in the same place and had equivalent water availability and light exposure.
- Independent Variable: The effect of four different pH solutions was tested on 16 plants, and 4 were used for a control (water of a neutral pH). The levels of pH that were tested include, >7.6, 7.4, Neutral, 6.6 and <6.4.
There were therefore 4 specimens being tested for each pH level. To ensure the validity of the investigation it was necessary to ensure that all 4 specimens for each group obtained their assigned pH levels. Five containers of water were used to disperse pH-altered water into each of the cups, in order to prevent variation of pH within the five different groups of plants. This eliminated error that may have occurred in attempting to individually alter the pH of the water that accommodated each plant.
Water was used instead of soil as this was the only possible way to measure root growth. I was also able to ensure the exact pH level of the water, which was not possible with the soil alternative, as it required more expensive equipment.
-Dependant Variable: Root growth of the perennial geranium cuttings was the dependant variable in this investigation, and was measured and recorded once a week. The same ruler was used for each measurement to ensure accuracy, and the results were recorded concisely in a journal to avoid misapprehension.
RESULTS:
Overall, the data collected from this investigation successfully demonstrates a change in phenotype. The results clearly indicate how organisms of the same genotype, inhabiting different environments will obtain different phenotypes. The root growth of the plants observed reflect this as there is a clear differentiation between the 5 groups of different pH. The control group with a pH of 7 (neutral) had the most substantial root growth in comparison with the groups with an altered pH. The slightly acidic (6.6) and slightly alkaline (7.4) groups had a similar amount of root growth, but the growth was significantly smaller in comparison to the neutral group. The remaining groups were high level acidity, and high level alkaline. Both these groups demonstrated very little root growth, and this is indebted to the severe alteration of pH as an environmental factor. All groups had very little, or no root growth until week three of the investigation. The following graph is an average of each group’s root growth over a period of six weeks:
PH 7 (NEUTRAL) GROUP:
PH 6.6 (SLIGHTLY ACIDIC) GROUP:
PH 7.4 (SLIGHTLY ALKALINE) GROUP:
PH <6.4 (HIGHLY ACIDIC) GROUP:
PH >7.6 (HIGHLY ALKALINE) GROUP:
An overall comparison of the average root growth of plant groups was made, in order to concisely determine the effect of environment on phenotype. This column graph clearly distinguishes each pH group from the other, effectively demonstrating the change in phenotype. Slight change to the pH of the water accommodating the plants resulted in the impediment of root growth, and therefore detectable change in phenotype. The plants that had the pH of their water changed dramatically had little or no root growth, causing a significant change in phenotype.
CONCLUSION:
-Reliability and Validity:
Through the control of variables and the use of five specimens per pH group (repetition), it would be correct to assume that the results gathered from the investigation demonstrate the effect of environment on phenotype and support the hypothesis.
The specimens used as a control and grown in distilled water with a pH of 7, demonstrate healthy root growth. When compared to the root growth of the groups with altered pH levels and the same genotype, it is evident that this change in the plants environment causes an alteration in phenotype.
However, there was one problem encountered when assessing the root growth of the group of plants with a high alkaline level (pH >7.6). A black fungi grew on all the stems of the cuttings, during the 3rd week of investigation. This was most likely caused by the high alkaline levels in the water. It appeared as if the fungi impeded root growth on this group of plants as only two cuttings showed signs of root growth. The two plants only sprouted one root both of 0.5mm in length. This became an uncontrollable variable, as it was impossible to conclude whether or not it was the alkalinity that was a direct cause of the little root growth.
If the experiment was repeated, I would further the investigation by researching the exact cause of the fungal growth and possibly reduce the pH level to gain results that would not be effected by the growth.
Regardless of this fault in the experiment there were still enough pH groups to compare to the control in order to make a valid conclusion. The other three pH groups (6.4, 6.6 and 7.4) all supported the hypothesis by demonstrating a change in phenotype in comparison to the control.