Preliminary work
The preliminary work involved finding the best possible yeast concentration and volume and substrate volume to use for the experiment. For a 3% volume of hydrogen peroxide, I observed the rate of reaction by noting the amount of oxygen collected in the gas syringe with time and decided if it was too fast or slow as I had to accommodate for the a 5% and 1 % concentrations as well. I chose 3% because it was half the concentration of my available concentration (I%-6%), and I can find a suitable speed of the reaction, which will still be within a range that can be easily read if the concentration was raised or lowered.
I first used 2cm3 of yeast and added 10cm3 of 3% hydrogen peroxide to it but the reaction occurred too fast and reached the limit of the syringe by 1 minute.
Then I reduced the amount of 3% hydrogen peroxide to 5cm3 and added this volume to 2cm3 of yeast but I found that the reaction was still too fast.
Finally I used 1cm3 of yeast with 5cm3 of the hydrogen peroxide at a 3% concentration and found that the reaction speed was at a decent rate. I tested my chosen volumes by checking the reaction speeds with a 5% and 1% concentration of hydrogen peroxide.
After observing the rate of reaction with a 5% solution of hydrogen peroxide noticed that the rate of reaction was noticeably faster and slower for the 1% solution of hydrogen peroxide. This justifies the main experiment that the rate of reaction increases with concentration of the substrate.
I then decided apon the time intervals that I should use. For my chosen volumes the reactions stopped and didn’t change for over 3 minutes so I decided that the time range that I would use would be a total of 3 minutes. In order to get as many results as possible but with a large enough interval I decided to use 30 second intervals for each of my concentrations.
Then I made the tables for the experiment. The table included each concentration of the hydrogen peroxide I was going to use with a place to write the volume of oxygen obtained against the time intervals (after every 30 seconds).
I then did a trial experiment to see what my results would look like. The results I obtained form this experiment were very good and were according top the desired pattern so I used it as my first set of readings for the main experiment.
The apparatus and method used for the preliminary work is the same as for the main experiment. I also tested the gas with a glowing splint which relighted which goes to show that oxygen is indeed produced.
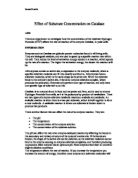
Variables
The independent variables are the concentrations of hydrogen peroxide as I vary the concentration to the way I want. I control these variables. This is why they are called independent variables.
The dependant variables are the volumes of oxygen produced because this depends on the concentration that I use to obtain the oxygen.
The other variables that have to be controlled are temperature, PH, concentration of yeast, and volumes of hydrogen peroxide and yeast.
I used a thermometer in the yeast to see if the temperature was constant.
To keep the Ph constant I used distilled water in my dilutions because distilled water is neutral and does not contain any impurities which could cause any inhibition of the enzyme. The yeast concentration was kept constant by using yeast from the same batch and not diluting it during the experiment and the repeats.
Apparatus
A gas syringe is used to collect the oxygen. I used this because it is easier to use a gas syringe by an individual as opposed to a measuring cylinder upturned in water as another person is needed to hold the cylinder upturned.
A conical flask is used with an opening for the connection to the gas syringe as well as a bung for the flask with a hole for a delivery needle. This sort of bung is best used so we don’t have to open and close the bung during the experiment. The flask is used for the mixing of the substrate and yeast.
A clamp and stand is used to hold the gas syringe in place so the I don’t have to worry about keeping the gas syringe level during the experiment. The gas syringe must be kept horizontal for accurate readings.
Rubber tubing to connect the gas syringe to the conical flask
A thermometer to measure the temperature.
Syringes to measure the volume of the solutions and to put the hydrogen peroxide through the delivery tube.
Beakers to keep the various solutions and distilled water in.
Catalase in yeast. I used yeast because it is in a liquid form and it is easy to measure out the amount needed in centimeter cube as opposed to potato or liver where one has to cut out the pieces and stuff the crushed pieces into a cut open syringe. It can also lead to more inaccuracies because yeast is able to donate almost all of its active sites because it is in a liquid while solids like potatoes or liver may have unreachable active sites within particles.
Hydrogen peroxide is the substrate as this is the only molecule the enzyme woks with as enzymes are substrate specific.
Stop watch to measure the time that we note the readings in volume of oxygen produced. The time should be the same for all concentrations.
Safety glasses as hydrogen peroxide is dangerous to the eyes.
Method/ Procedure-
The apparatus is set up as shown.
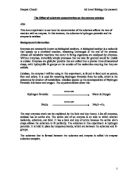
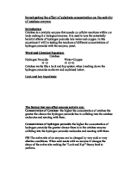
The concentrations of hydrogen peroxide have to be made. We were given a 6% concentraton of hydrogen peroxide. This means that there is 6g of hydrogen peroxide in 100cm3 of water. If we take 10cm3 of the solution there would be 0.6g of hydrogen peroxide in it. If we want a 5% solution of hydrogen peroxide, we can calculate the amount of water we need to add to the 10cm3 of 6% hydrogen peroxide solution.
The value of x gives us the amount of water needed in centimeter cube. We can also find the amount of water needed to make the other concentrations by equation the equation to the corresponding concentration required. In the above case the amount of water required is 12cm3. Therefore we have to add 2cm3 to a 10cm3 solution make a 5% solution. Using the equation and subtracting 10cm3 from the obtained value we can make the following table that shows the amount of water required:-
The temperature of the yeast and hydrogen peroxide is constantly checked as it has to remain constant during the whole experiment. It is best to wait till they fall to room temperature.
1cm3 of yeast is measured out in a syringe and is added to the conical flask and the bung replaced.
The 5% solution of hydrogen peroxide is measured to 5cm3 in a syringe and squirted into the flask through the delivery needle in the bung. The stopwatch is simultaneously started.
Bubbles start to form in the conical flask and the gas syringe moves outwards.
Every 30 seconds the amount of oxygen produced is read off the graduation on the gas syringe to one decimal place.
The measurement is continuously noted at every 30-second interval until 3 minutes are up.
The experiment is repeated for hydrogen peroxide concentrations of 4%, 3%, 2%, 1% and distilled water (which is the control).
The whole experiment is repeated three times and an average is taken for each experiment.
A graph can be plotted for each concentration with the concentration of the hydrogen peroxide on the x axis and the volume of oxygen produced on the y-axis.
From the graph I found the gradient, which is the rate of reaction.
Another graph can be plotted with concentration of hydrogen peroxide on the x axis and the rate of reaction on the y axis.
Fair test
To ensure a fair test I used yeast because it is easier and more accurate to measure out the yeast as it is in liquid form. The liquid form of the yeast solution enable all the active sites of the yeast to be used out. The hydrogen peroxide can diffuse into the yeast and all the yeast cells can be well surrounded by the substrate molecules. To use a solid such a potato or liver as a catalase source would mean cutting it up and crushing it up. This is difficult to measure out as well as the fact that active sites with the crushed particles may be unreachable by the hydrogen peroxide molecules. With using potatoes or liver etc. you can’t be sure if the concentration of catalase is constant. One potato may have more catalase than another. This could lead to inaccuracies and thus an unfair test.
Other factors needed to ensure a fair test is keeping the temperature, air pressure, volume of hydrogen peroxide, volume of yeast, concentration of yeast, type and batch of yeast constant.
The reading taken from the gas syringe must be read perpendicular to the graduation to avoid a parallax error and retain the accuracy of the experiment.
The reliability of the experiment was conserved by repeating the experiment. In this case the experiment was repeated three times with a similar pattern of results.
The control is the use of distilled water (a concentration of 0%) to show that it is indeed because of the enzyme catalase acting on the hydrogen peroxide.
Safety
A strong solution of hydrogen peroxide can cause burns so gloves should be worn for a strong concentration.
A pair of safety glasses should be worn at all times cause hydrogen peroxide can irritate the eyes.
For the experiment we only used 20 volume hydrogen peroxide which is a relatively safe concentration. Although eye protection must still be worn.
Pupils should check that over frothing does not occur during the experiment.
If swallowed mouth should be washed and a glass or two of water drunk. Seek medical attention.
If liquid gets in your eyes flood the eye with gently running water for 10 minutes. Seek medical attention.
If spilt on skin or clothes. Flood area with large quantities of water. Remove and soak contaminated clothing. If lasge area is affected or blistering occurs seek medical attention.
If spilt… wear protection and cover with mineral absorbent and clear up into a bucket. Rinse several times. Add water to dilute thoroughly and wash down the drain.
Dispose of by diluting thoroughly in water and pour down the drain.
Results
The average results are obtained by adding each value of the volume of oxygen obtained of each corresponding time interval of each concentration and dividing it by three.
The table of average results follows:-
Analysis of evidence
The following graphs display the results and show how the reaction progresses for each concentration of hydrogen peroxide. Anomalies are circled on the graphs itself and error bars are added for each value. The Rate of reaction can be found for each of the concentrations by finding the gradient. The gradient was found by drawing a tangent on the steeper part of the graph, so a tangent was drawn at 0.5 minutes for all the graphs.
Trends and patterns
The graphs clearly show that the rate of reaction decreases with decreasing concentration. In the lower concentrations the leveling off of the curves can be more clearly seen.
This proves that the rate of reaction increases with increasing concentration; therefore the rate of reaction is directly proportional to the concentration of hydrogen peroxide. Hence we know that when the concentration of the substrate is high there are more substrate molecules to be broken down by the active sites on the enzyme molecules and the rate is high as can be seen at the 5% concentration in the graph showing the rate of reaction against concentration. But when the concentration is lower the number of substrate molecules decrease and the number of active sites being used also decrease correspondingly and as we expect the rate of reaction has also decreased.
Another way of analyzing these graphs is the total volume of oxygen obtained in the end. Here we can clearly see from the graphs that the total volume of oxygen obtained after 3 minutes is larger for the 5% concentration and decreases with decreasing substrate concentration as well:
From the curves on the graphs of Volume of oxygen against time we can see that the reaction starts to level off after a while. This is because the number of hydrogen peroxide molecules are reducing as they are being broken down into water and hydrogen and fewer active sites are being used. As the number of substrate molecules present start to fall the number of active sites in action is also less. As mentioned earlier this causes the rate of reaction to fall and so the curves tend to straighten on the graph. In the beginning of the reaction the gradient is very steep, and this is because of the high concentration of substrate molecules that efficiently uses as many active sites as possible and so the rate is fast. These typical curve shapes are similar for all the concentrations, which adds weight to the reliability of this experimentation method.
In the graph of rate of reaction against the concentration of hydrogen peroxide, shown above, we can see that the rate clearly increases with the concentration of hydrogen peroxide. This is because a higher concentration of the substrate means that there are more substrate molecules in the solution and more active sites are used at any given time during the reaction. Therefore the reaction progresses faster. A low substrate concentration means that there are fewer molecules of the substrate and consequently less active sites of the enzyme are used at a given time during the reaction. Therefore the reaction progresses slowly. However I would expect there to be a limit. As the concentration increases the substrate molecules would eventually exceed the number of enzyme active sites and the reaction will no longer increase in rate in spite of increasing concentration as all the active sites are being used up and no more are available to speed up the reaction any more. This explains in the gradual straightening out of the curve, which implies a smaller increase in the rate of reaction, and it demonstrates this point. The excess hydrogen peroxide molecules have to wait for an active site that is not occupied in order to use it. I reached full saturation in the lower concentrations of substrate. The leveling off of the curve in the rate of reaction graph was difficult to demonstrate because I had a limit of a concentration of 6%. At 6% my reaction was too fast to record and reached the limit of the gas syringe within 30 seconds so this concentration was not recorded.
When looking at the rate of reactions we can notice that the rate of the 2% concentration is around twice the rate of the 1% concentration. From this information I can safely say that if the concentration is doubled the rate of reaction doubles. This is because there are twice as many substrate molecules and twice as many active sites are used up. The difference in the rate of reactions from 3% onwards however is less because the active sites are gradually becoming saturated as the concentration increases. However experimental error may account for the inaccuracies and anomalies of the graphs as well. The gradient of the graph does decrease which shows that the rate of reaction is slowing down which proves the nearing of the reaction towards its saturation point when virtually all the active sites are being used up and is said to be saturated. On a graph this point is known as the Vmax.
Anomalies
An anomaly existed in the reading on the graph at 2.5 minutes for the 3% concentration of hydrogen peroxide. However this will have no effect on the graph showing rate of reaction because the rate of reaction was only calculated for the first 30 seconds. The graphs otherwise show the desired pattern and error bars have been used to show to show the variation from the obtained value. The error bars show the variation by marking the least and greatest value obtained at each time interval for each graph. The following tables show the variation of each reading at a glance, in other words, they give he value of the error bars for each point. It also helps us look at the variation in the obtained values with greater detail. The size of the variation and the type of trend or pattern in the graph will give us a hint on how reliable the experiment was.
In my opinion, although there existed some variation with the points it does not change the expected trend a great deal.
The repetition of the experiment three times ensures that the errors in the obtained values are minimal and even more repeats would have reduced the errors even further, but this could not be done due to the time constraints.
The graph for the rate of reaction against concentration seems to have an anomaly at the 5% concentration, but again despite the large variation the expected trend still exists and that is an increase in the rate of reaction with increasing concentration.
Evaluation
I chose to use graphs to display my results because they can clearly show how the reaction progresses in terms of rate and volume of oxygen obtained in the end. This gives us a general idea of the reactions and makes it easier to compare the different reactions easily so we can see the obvious increasing the rate of reaction with increasing concentration. The graphs also show the endpoint of the reaction so we know when the reaction starts to slow down and stop.
The trends shown by the graph are consistent with the hypothesis of the experiment and thus we know that the results are reliable to some extent. We can confirm this fact by seeing that the lines do not intercept ( the value for the volume of oxygen is different for each interval of each concentration helping us compare the rates easily and is also what we would expect after reading the hypothesis.)
The numbers of anomalies are very small (just one significant one). The anomaly found doesn’t affect the rate of the reaction as it is not within the first 30 seconds of the experiment as only the first 30 seconds were considered for the rate of the reaction.
These results can be further confirmed as reliable because the rate of reaction and volume of oxygen obtained is higher for the 5% concentration which shows that this has a higher concentration that the other substrate concentrations.
From the rate of reaction graphs we can easily see that the rates increase with concentration, but we also not the decreasing gradient as the reactions reach the saturation point.
There are very few large variations in the values of volumes of oxygen obtained (i.e small error bars). The variations are all below +/- 10cm3.
To increase the accuracy of the experiment the readings for each concentration was repeated 3 times and the average values were taken. The graph was plotted with the average values and the curve of best fit drawn.
All variables other than the concentration of hydrogen peroxide were kept the same as far as possible but it was sometimes difficult to keep some of the variables constant for example the temperature of the yeast was 31 degrees celcius but fell to around 28 degrees celcius during the experiment.
The atmospheric pressure and humidity was of course beyond my control so I assumed it to be constant throughout the experiment.
The yeast was obtained from the school technicians and every new batch was also assumed to be of the same concentration and type and although there may have been small differences in the concentrations.
It is also difficult to measure out the precise amounts of yeast, hydrogen peroxide and water from the syringes as the graduation was only to the nearest mm3 and so the volumes used could vary by +/- 0.5mm3.
The bung should be pushed down equally and the conical flask should be of the same volume as this can affect the amount of oxygen being pushed into the gas syringe. Unfortunately the conical flask bung used in the first set of results stopped sealing the conical flask properly so I had to switch to another conical flask of a smaller volume which was the only other conical flask at that time.
The Gas syringe used was a constant problem because they would sometimes become stiff overnight and had to be changed. I also realized during the experiment that each gas syringe has a different stiffness or the stiffness of one can change over night and drying it out doesn’t always make it better.
Reading the gas syringe at a specific moment in time as required by the experiment is difficult because the gas syringe is constantly moving.
Critical analysis
This is only a single investigation of substrate concentration. I could improve my results even further by using other sources of catalase like potato and liver. Other techniques such as downward displacement of water can be employed to collect the oxygen. I could even compare my results with others who have done the same investigation. If I got similar results with different techniques then it would further confirm my results of the experiment.
Improvements
A number of improvements could’ve been made.
The experiment could have been repeated several times more so that the errors in a single experiment can be compensated for by other experiments and a better overall result would have been obtained.
I could have used more concentrations of hydrogen peroxide to get a larger number of results for each concentration and thus a better curve on the graph. The concentrations could have been between the concentrations already used such as 1.5% and 2.5% etc. If higher concentrations of hydrogen peroxide were available I could have continued the experiment right to the saturation point but we were limited to a 6% concentration.
Someone else could have read the graduation while I looked at the time to get a more accurate reading of the volume of oxygen obtained, as the gas syringe was constantly moving during the experiment, or an even better method would be to use an electronic instrument to measure the volume of the oxygen more accurately. It could also be connected to a data logger to measure the corresponding time as well. One method could be to measure the pressure changes caused by oxygen in a closed system electronically.
I could have used a buffer solution to ensure that the PH is constant.
The experiment could have been carried out in a water bath to keep the temperature constant because small differences in temperature can significantly affect the rate of reaction.
A Haemocytometer could have been used to measure the concentration of the yeast to see if it was absolutely constant.
Conclusion
Hence the hypothesis of substrate concentration increasing the rate of a catalysed reacyion till the end point is confirmed.
In the context of cell metabolism, these reactions are potentially important in the controlling different types of reaction. In many cases the substrate concentration is a very important factor in the rate of a reaction but from this experiment we can also see that for some other reactions enzyme availability is also critical.