From the preliminary experiment I can see that the potato chips gained mass when they were put in distilled but lost mass when they were put in 25% sucrose concentration solution.
I also found out that the potato chip that was put in air lost a very tiny amount of mass. I think this is due to the evaporation of water from the potato cells when it was left in a specimen tube filled with air. After having found this out, I now know that I need to improve the accuracy of my experiment by not leaving the potato chips out in the air for a long time before putting them in the solutions as they would lose mass via evaporation.
I also need to use a larger range of sucrose solutions as 2 concentrations of sucrose solution do not give me any apparent changes or the full information about osmosis in potato cells. In the real experiment I am going to use 5 different concentrations of sucrose solution-each are of 5% sucrose concentration difference. They are going to be:0%(distilled water), 5%, 10%, 15%, 20%. I chose this range as the ‘gaps’ between them were not too big or too small so that I couldn’t notice any differences in the potato chip masses.
Change/Improvements in method
I have to try and cut out the potato chips very quickly and blot them dry quickly, weigh them and immediately put them into the specific specimen tubes with the different concentrations of sucrose solution. But also remembering that all the potato chips have to be put in about the same time and for the same length of time.
Main Experiment
Prediction
From what I know about osmosis and with the help of the results from my preliminary experiment I can make my prediction of what happens to the potato chips in different concentrations of water molecules.
My prediction is that when the concentration of water molecules in the potato and in the solution is different there will be a change in mass in the potato chip. The mass will decrease when the concentration of water molecules is lower in the solution than in the potato cells e.g. when the potato chip is put into a 20% concentration sucrose solution.
The mass of the chip will increase when it is put into a solution that has a higher concentration of water molecules than in the potato cells e.g. when the potato chip is put into a 0% concentration of sucrose solution i.e. distilled water .
I also predict that when the sucrose solution gets nearer to the potato’s concentration there is less change in mass. I predict that the net flow of water from one side of the selectively permeable membrane to the other side increases when there is more difference in the 2 concentrations of water. I also predict that when the concentrations of the potato cells and the sucrose solution are the same then there will be no net flow of water by osmosis and no change in mass of the potato chip. I have made this prediction based on what I know about osmosis already and what I have seen happening in the preliminary experiment.
I can make this prediction based on my background knowledge of osmosis and my preliminary experiment results show what they show.
When the potato chip was put in distilled water, there is a higher concentration of water molecules in the distilled water than in the potato cell. This leads to a net flow of water from the distilled water into the potato cells by osmosis through the selectively permeable membrane-potato cell membrane. As the potato cells take in more water molecules the vacuole gets bigger and this pushes out the cytoplasm firmly against the cell wall that is why they increase in mass and feel turgid.
In the preliminary experiment when the potato chip was put in the 25% sucrose solution, there was a higher concentration of water molecules in the potato cells than in the solution. This means that there was a net flow of water molecules are from the potato cell through the cell membrane and into the sucrose solution. The potato cells lost water, which means that they are losing mass as well. The cell shrinks away from the cell wall making the potato cell become very floppy and flaccid.
Fair Testing
During the planning of the method of this experiment I must consider things that I have to control in order that the experiment is a fair test and that I only change one variable in each experiment-the concentration of the sucrose solutions, which I have decided to use as 0%, 5%, 10%, 15%, 20% sucrose solutions.
This means that I have to keep everything the same- the potato chips have to be the same length and from the same potato tuber. I also have to make sure I use the same apparatus and if there is more than one type of apparatus required I should make sure that they of the same type, which means I have to use the same cork borer to cut each chip so that each of them has the same surface area, the same top pan balance to weigh the mass of the chips, use the same type of specimen tubes, white tile, scalpel and paper towel.
I also have to remember to use the same amount of solution in the specimen tubes- 25cm3 as if I put more solution it will affect the rate of osmosis.
I also have to attempt to keep the temperature constant/the same as this will also affect the rate of osmosis. If the temperature is higher then the water particles have more energy and move faster through the selectively permeable membrane, which will lead to more increase in mass for the potato chip than other potato chips that were probably done in a lower temperature. This will then lead to anomalous results and unfair testing. To prevent the experiments done in different temperatures I could try to do the experiments on the same day and in the same surroundings- i.e. in the same room with the same things.
*
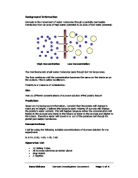
Apparatus
- Cork borer
- 2 potato tubers
- Scalpel
- 5 Specimen tubes with bungs.
- Top pan balance
- White Tile
-
10cm3 Syringe
-
25cm3 of each of the following concentrations of sucrose solution 5%, 10%, 15%, 20%, and distilled water, which has a concentration of 0%.
- Forceps
- Paper towel
Method
Using a cork borer I will cut out 5 potato cylinders. To make sure they are of the same length and diameter I will line them up and use a scalpel to cut the ends so they are of 4.5 mm in length.
I then have to blot them dry with a paper towel to remove surface water. I will then weigh each one on the top pan balance and record the mass (grams to 2.d.p.) in a table below.
I will fill each specimen tube with one of the different concentrations of sucrose solution so that one specimen tube has 25cm3 of distilled water and another has 25cm3 of 5% sucrose solution etc.
I will put one potato cylinder in each of the filled specimen tubes and put the bung on. I will leave the potato cylinders in the specimen tubes for 21 hours. After the potato cylinders have been left in the solutions for 21 hours, I will take the potato cylinders out of the specimen tubes with forceps. I will put the wet potato cylinder on a paper towel and blot them dry. I will put them on the top pan balance and record the mass in the table shown below.
I will then calculate the mass change and the percentage change. Also note down the state the potato cylinder is in-is it flaccid or turgid. (changes in mass have to be recorded to 2.d.p)
Use these calculations for the changes in mass:
The change mass=mass after 21 hours – start mass
Percentage change in mass=change in mass/start mass x 100.
(Note that the signs before the values are to show whether they have lost mass (-) or gained mass (+). They are not to be used in the calculations themselves.)
Repeat the experiment 3 times to get reliable results and to spot any anomalous results.
Safety
The most important thing of any experiment is that it is safe so people doing the experiment are not at any major risk of injury.
This experiment is not dangerous if the apparatus are used carefully. The scalpel and cork borer should be used so that my fingers are not at risk of getting cut or injured. Hair should be tied back so I can see what I am doing especially when I am using the scalpel or cork borer to cut the potato chips. The white tile should be put underneath the potato tuber that is going to be cork bored so that the cork borer does not go through and damage what is at the other end.
*
I followed my method and repeated the experiment 3 times. I did it 3 times so I could get reliable results and I would be able to see any anomalous results. I have also taken average results, which will be used to plot a graph so I could see trends and patterns. I left the potato chips in the concentrations for 23 hours and 20 minutes. This is a good time period as it isn’t too short so changes in mass cannot be detected and it also is not too long that the potato chip doesn’t begin to disintegrate, which will make the accuracy of the experiment poor.
I recorded the masses before the experiment, after the experiment and the change in mass in grams and also as a percentage. I used the same calculations when working out the mass change as I did for the preliminary experiment.
The results and graphs are on the next couple of pages.
Observations
As you can see from the table of results, as you get beyond 10% concentration of sucrose solution the potato chips’ mass starts to decrease and also the potato chip starts to become flaccid. The potato chips in the concentrations that were lower than 10% increased in mass and became turgid.
What the graph shows
The graph shows that if the concentration of the sucrose solution is below 13.5% then the mass of the potato chip increase. When the sucrose solution percentage is above 13.5% then the mass of the potato chip decreases. It also shows that as the concentration of the sucrose solution gets nearer to the concentration of sucrose in the potato-13.5% the change in mass gets less and less.
The graph also shows that when the concentration of the sucrose solution is13.5% than there a no change in mass-shown by the line of best fit crossing the x axis and y axis which indicates it as 0g change when the sucrose solution concentration is 13.5%.
*
Conclusion
I found out that when the potato chip was put in a sucrose solution that had a lower water concentration than inside the chip i.e. greater than 13.5% sucrose solution, the chip decreased in mass as there was a net flow of water from the potato cells into the solution. This happened because there was a higher water concentration in the potato cells than the sucrose solution. The mass of the chip increased when the concentration of the water molecules in the sucrose solution is higher than the concentration of the water molecules in the potato cells then the potato chips gains mass. This happened when the percentage of sucrose in the solution was lower than the percentage of sucrose in the potato cells-13.5%. The line of best fit also shows that when the concentration of the sucrose solution is 13.5% then there is no change in mass. I have found out that there is no change in mass as the potato cells’ sucrose concentration is also 13.5% which means there are the same concentration of water molecules in the potato cells as in the sucrose solution resulting in no net flow of water by osmosis. This means that my prediction is correct.
Osmosis is evident in the graph that I have produced and in the table of results. I can use my correct prediction to explain why the graphs show the results I have recorded.
Why does the graph show this?
The graph shoes that when the concentration of sucrose solution is lower than the concentration of sucrose in the potato cells (13.5%) then the mass of the potato chip increases. This is because there are more water molecules in the sucrose solution than in the potato cell. This results in osmosis where the net flow of water is through the potato cell membrane (selectively permeable membrane) and into the potato cell. The increase of water molecules means an increase in mass for the potato chips.
The graph also shows that when the concentration of sucrose solution becomes nearer or more similar to the sucrose concentration of the potato cell, less increase in mass occurs. This is represented by the ‘line of best fit’ sloping downwards. This happens because as the two concentrations of water molecules on either side of the potato cell membrane have a similar concentration of water molecules. Therefore the net flow of water molecules from each side would differ very little until the both sides had the same number of water molecules and the net flow of water would be the same. And if the small net flow of water is from the sucrose solution into the potato cell, there would not be much change in mass as very little net flow of water molecules would have gone into the potato.
Whereas if there was a big difference in water concentration either side of the potato cell membrane, there will be more net flow of water molecules from the side with the higher concentration of water molecules into the side with a lower concentration. If the side with the higher concentration of water molecules is the side with the sucrose concentration, then most of the net flow of water molecules would be from this side into the potato cell. This results in a big increase in mass as a lot of water molecules have gone into the potato cell because the water concentration gradient is steeper.
Where the line of best fit crosses the x axis at 13.5% sucrose solution and 0 mass change it shows me that the concentration of sucrose solution (also concentration of water molecules ) is the same as the concentration of sucrose or water molecules in the potato cells. The equal concentrations in the solutions would result there being no change in mass hence the 0g. This is because there is the same number of water molecules on either side of the potato cell membrane therefore the same number of water molecules will be passing from either solutions resulting in no net flow of water by osmosis and no change in mass in the potato chips.
To conclude, I can say that:
Evaluation
I think that this experiment went quite well as I received reliable results. I think this is the best method for this osmosis experiment as it produces reliable results if followed correctly. However, I think there are areas where accuracy can be improved upon. This requires me to think of more minute areas where slight errors could affect the overall accuracy of the results.
For example, even though I cut the potato chips with the same cork borer, it did sometimes produce chips of different widths. This could have affected the rate of osmosis as some potato chips may have much more potato cells than others, which means that they need the different amounts of water molecules to make them turgid.
The next time I do this experiment I could consider using a machine or another instrument that could cut the potato chips so they were of the same mass, width and height.
Also, I used two different potatoes to cut the potato chips, this could also affect the results as it wouldn’t be a fair test-one potato tuber may have very different cells to the other, which may mean that the potato cells may have different concentrations of sucrose in the cell sap. In the next experiment I should use a very large potato tuber so most of the potato chip cells cut from it would be very similar.
I could also use more accurate measurements of masses and this will give me more accurate changes in mass. To this in a future experiment that requires a weigh, I could use one that will give more accurate masses e.g. gives masses to the nearest 0.0001g instead of the normal 0.01g.
Even though the results were fairly close to ‘line of best fit’ on my graph, there was one that was not as close to the line of best fit than the others. I think this result is a slight anomalous result as the mass is slightly lower than of the expected mass shown by the line of best fit. I think this was probably caused when I blotted excess water off with a paper towel, I took off too much water and therefore took off some of the mass too but the result still supported my conclusion as it followed the overall trend of the data.
In order to make sure this does not happen again, I need to have a system or way of taking the same amount excess water off all the potato chips. Maybe next time I could roll each potato chip down the paper towel once and blot the ends of them two times on the paper towel.
To prove that my prediction is correct in any osmosis experiment, I could do another experiment, which shows osmosis happening and why it happens-different concentrations between a selectively permeable membrane. The experiment is shown below:
Apparatus
- 20cm in length visking tubing.
-
20cm3 water
-
10cm3 plastic syringe
- testing tube
Method
Tie a knot at the end of 20cm length visking tube that has been soaked in water. Put 3cm3 of strong sugar solution in the plastic syringe and use that to partly fill the visking tube-it should be floppy. Place the visking tubing into a test tube containing water 20cm3 . Leave the visking tubing in the test tube for about 30-45 minutes.
You should record your observations of the visking tubing before it was put into the test tube of water and after it had been left in the water. Look for any changes in how it looks and feels. Is it turgid or flaccid?
Diagram
References
Collins GCSE total revision Science by Mike Smith and Chris Sunley
GCSE Biology second edition by D.G. Mackean
Sheena Lam
Candidate number: