Competitive inhibitors compete with the substrate and bind to the active site of the enzyme and therefore do not allow the substrate to be converted into its products. This also reduces the rate of reaction. Non-competitive inhibitors bind to the allosteric site of an enzyme and change the active site slightly; therefore the substrate can still bind to the active site. However, it cannot be changed into its products until the inhibitor has moved. This has a detrimental effect on the rate of reaction.
Reversible inhibitors only bind to the enzyme for a limited time and consequently only affect the rate of reaction temporarily. Non-reversible inhibitors bind permanently to the enzyme causing irreparable damage and a lasting reduction in the rate of reaction.
The Validity of results
A definition for accuracy is the correctness of the results compared to the true actual value. A definition of precision is a measure of the spread of results. The smaller the spread of the data, the more precise the results will be. Precision is also linked to reproducibility or repeatability. Reliability is a measure of the consistency of the results and is linked to both accuracy and precision. Reliability is a measure of the accuracy of the individual results as well as how close replicates of the experiment are.
The resulting data can be precise alone, accurate alone, neither or both. When the results are both accurate and precise and therefore reliable the conclusions drawn from them are valid. For this reason in my experiment I will use the most accurate equipment available to me and conduct the experiment in such a way that the results obtained will be both accurate and precise and therefore I will be able to have reliable and valid results.
Prediction:
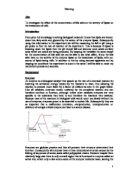
I believe that increasing the concentration of bile salts should allow the rate of digestion of milk by lipase to increase. Bile salts are the main constituent of bile, which in the body is secreted to emulsify fats (break them up into small droplets), thus increasing the surface area to volume ratio available for the enzyme lipase to attack and so increasing the rate of reaction. However, I believe that after a certain concentration of bile salts is added, the lipids will be unable to be emulsified further and so the rate of reaction should reach a plateau as bile salt concentration is no longer a limiting factor. A graph of pH against time will show that as lipase is added to the solution a drop in pH will ensue due to the fatty acids having an acidic carboxylic acid group which will neutralise the alkaline environment and make it drop to neutral and maybe even acidic pH.
The final prediction graph that I will make is the activity of lipase against the substrate concentration. The reason I will plot these two variables is because the bile actually acts on the substrate and emulsifies it increasing the surface area. This means in the proportional part of the graph the substrate concentration is the limiting factor that determines the gradient of the graph and therefore the rate of reaction. An increase in substrate concentration will lead to an increase in the rate of reaction proving that it is in fact the limiting factor. In the plateau region of the graph, the enzyme concentration limits the rate of reaction, as mentioned in my background information, due to the unavailability of free active sites to catalyse the reaction. The enzyme concentration is the limiting factor.
Apparatus:
Dilution Table:
We are given a 5% concentration of bile salt solution/emulsion. To make up the solutions with different concentrations take a volumetric flask and add the amount of bile salt solution needed to make up the solution as shown in the table below. Top up the volumetric flask with water until the calibration mark. Place the bung and shake the solution thoroughly 5 times using and up and down motion. Repeat for different concentrations of bile salts as needed.
Calibration of the pH probe
-
Take the yellow pH 7 buffer solution and measure out 20cm3 using a measuring cylinder and pour into a labelled beaker.
-
Take the red pH 4 buffer solution and measure out 20cm3 using a measuring cylinder and pour into a labelled beaker.
- Take the probe out of the cleaning fluid and dry in with some tissue.
- Place the dry probe into the yellow pH 7 buffer solution and reset the pH sensor. The pH on the sensor should now read 7.
- Take the probe out of the yellow buffer solution. Clean the probe with distilled water and dry.
- Place the dry probe into the red pH 4 buffer solution. The pH on the sensor should now read 4.
- The pH probe is now calibrated and ready for use.
Safety:
Working in the lab, usual safety requirements of not eating or drinking are useful. People should make sure they tie long hair and pull all dangling items back. A lab coat is also a very good way of protecting a person clothes. Gloves and goggles should be worn while handling chemicals.
All the chemicals used in this experiment are quite dangerous unless used in a suitable and sensible manner. Always stand when conducting experiments and handle glassware with care. Any broken glass should be reported immediately and placed in the broken glass bin.
Sodium hydrogen carbonate should be kept away from heat. It is an irritant and should be washed off the skin straight away. It is also an alkaline solution.
Lipase is an enzyme. It is an irritant. If it gets into the eye or on the skin it should be washed off immediately. Bile salts are also irritants and should not be ingested. If they are swallowed the mouth should be cleaned with water and medical attention should be sought.
Additionally, a well ventilated lab allows large amounts of the gas to disperse.
As with most biological material, goggles and gloves should be worn when handling bile salts to reduce the risk of disease being transmitted.
Fair Test:
The only variable I am changing is the concentration of bile salt solution.
Temperature affects the rate of reaction because at lower temperatures the molecules move very slowly with little energy, so it is very rare for collisions to occur, therefore the rate of reaction is decreased. At higher temperatures, the molecules are moving faster with more energy so collisions happen more frequently, causing the rate of reaction to increase. However, with enzyme at specific temperatures, the bonds that hold the quaternary structure are broken, particularly hydrogen bonds. This causes the 3D structure to change, and therefore the active site changes shape. The substrate is no longer able to bind to the active site and be converted into the product. The enzyme is denatured, often irreversibly, and the rate of reaction decreases.
The concentration of the lipase will affect the rate of reaction. If you increase the concentration, there are more active sites for the lipids to enter; therefore this increases the rate of the reaction.
Stirring, agitation, affects the rate of reaction as it can help the substrate find the active site of the enzyme, therefore, increasing the rate of reaction. I will try to keep movement to a minimum while I am conducting my experiment.
Increasing the concentration of lipids (substrate) increases the rate of reaction, as it is more likely that the substrate will find a free active site and bind to it and be converted to the products. However, there is a maximum point (Vmax) where increasing the substrate concentration stops increasing the rate of reaction. This is because all active sites are working simultaneously and the substrate molecules are queuing up for a vacant active site.
In my experiment it is imperative I use a buffer (milk) as this will help the pH remain constant before the enzyme is added to the solution. Even though I will be looking at a change in pH that is relative to the start pH, I need to keep the initial pH fluctuations minimal because this reaction is catalysed by an enzyme. By adding the buffer I am keeping the pH conditions the same, and therefore the enzymes’ rate of reaction will only be affected by the variable I am changing and not other extraneous factors.
The optimum pH of lipase is 8.0-9.0. If there was even the slightest deviation from this optimum pH, the turnover rate of lipase will be altered and so the results taken will not be accurate or reliable as they are measuring the effect of both the change in initial pH and the concentration of bile salts. Thus the effects of two unknowns cannot be simultaneously investigated and so the results will suffer.
Preliminary:
Preliminary Method:
-
Add 20cm3 of milk into the beaker using a measuring cylinder.
-
Add 5cm3 of milk into the beaker using a measuring cylinder
-
Add 5cm3 of the bile salt solution at the required concentration using a measuring cylinder.
- Add a few drops of phenolphthalein indicator.
-
Add 10cm3 of the 5% lipase solution using a measuring cylinder, into the beaker containing the alkaline milk and the bile salts.
- Record the colour of the solution every 10 seconds.
- Repeat for the same concentration and other concentrations of bile salts.
After researching the background of this experiment, I decided that I would have to measure the change in pH over a certain period of time in order to determine the rate of reaction of lipase. The first thing I decided to use to monitor the change in pH was by using an acid-alkali indicator phenolphthalein. It is colourless in acidic conditions and pink in basic conditions. When I added the phenolphthalein to the milk it gave a nice pink colour after the sodium hydrogen carbonate was added. However, after I added the bile salts the pink colour was mixed in with a light brown colour and this made it difficult to distinguish when the pink colour disappeared after lipase was added and a drop in pH ensued. Additionally, the experiment was over very quickly and so timing at different intervals was very difficult as well as distinguishing the absence of the pink colour. To improve I thought it would be a good idea to use an indicator which was colourless in alkaline conditions and for example red in acidic conditions to help distinguish colour change, however, I could not find a suitable indicator.
For this reason and to overcome the problem of human error which is incorporated in taking readings from a moving stop watch, I decided to use a pH probe to record both the pH and the time taken. Also, a pH probe could actually give a numerical value to the pH instead of a simple colour change that the indicator would have given. This allowed me to conduct the experiment over the same time period instead of having to vary the time in accordance with the colour change. After that I decided to conduct the following trials listed in the table below.
A table to show the different preliminary trials that I undertook
For the first trial the amounts of each component was chosen to try and get the right proportions of each constituent in order to get a good gradient for the exponential graph in a reasonable amount of time. The first trial gave a fairly good curve and so I decided to see if it would give a good curve for the 1% bile salt concentration as well.
Trial two was to see if changing the concentration of the bile salts from 5% to 1% still yielded a good graph in a reasonable amount of time. After doing the trial the graph was not steep at all and the gradient that I got was not good, as even though the pH had dropped as expected, the rate of reaction was too small to measure accurately.
This led me on to trial three. Here I doubled the amount of bile salts that I used and did the test on the 5% bile salt concentration. The graph yielded had a good gradient, however, the amount of bile salts lowered the pH of the reactants too quickly and so this would have had a detrimental affect on the results gained from the experiment.
In the fourth trial I decided to make the milk alkaline to pH 8.5, using the sodium hydrogen carbonate in a separate beaker instead of adding 10cm3 separately. This made the environment of the lipase completely constant and always at the same pH. I also increased the volume of lipase to see if the results would be any better. The graph was the best graph so far and had the best gradient.
In the fifth trial I was trying to confirm if the fourth trial proportions were the best. I placed double the amount of bile salts as in the fourth trial, but kept the same amount of everything else. The drop in pH was too fast and the gradient was too steep.
For the above reason I believe that the fourth trial held the best proportions of each reactant and so this had informed me of what to do in my method.
Final Method:
- Place a clean conical flask into the preheated water bath at 30°C.
-
Place a beaker in the preheated water bath. Measure out 100cm3 of milk using a measuring cylinder and pour in to the beaker. Place the calibrated pH probe into the beaker and monitor the pH. Using a measuring cylinder measure out some sodium hydrogen carbonate and pour it into the beaker. Monitor the change in pH. If the pH is now at 8.2, use a teat pipette to make the milk more alkaline to pH 8.5. When adding the sodium hydrogen carbonate, stir the solution three times clockwise using a stirring rod and leave to settle for 10 seconds before reading the pH. If the pH is slightly greater than 8.5 add some milk using a teat pipette until the pH of the milk is at 8.5.
- Place a conical flask into the preheated water bath and label it.
-
Add 20cm3 of the alkaline milk into the conical flask, which is in the water bath to ensure a constant temperature, using a pipette. Make sure that the milk is measured precisely by ensuring that at eye level the bottom of the meniscus of the milk touches the calibration mark on the pipette.
-
Add 5cm3 of the bile salt solution at the required concentration using a different pipette into the conical flask containing the alkaline milk. Make sure that the bile salt solution is measured precisely by ensuring that at eye level the meniscus of the bile salt solution touches the calibration mark on the pipette.
- Stir the solution thoroughly using a stirring rod 3 times clockwise to ensure precision in the agitation.
- Place the calibrated pH sensor into the test tube and allow it to start recording.
- Use a thermometer to check the temperature of the solution and write this down. This is to ensure the start temperature is the same for all the experiments.
-
When the time reaches 20 seconds, add 10cm3 of the 5% lipase solution into the conical flask containing the alkaline milk and the bile salts, using a different pipette. Make sure that the lipase solution is measured precisely by ensuring that at eye level the meniscus of the lipase solution touches the calibration mark on the pipette.
- Allow the pH probe to take readings for 120 seconds. The length of the experiment has to be the same each time to ensure a fair test. Repeat for the same concentration and other concentrations of bile salts. The experiment should be repeated three times for each concentration. The ranges of concentrations in the experiment are 0%, 1%, 2%, 3%, 4% and 5% bile salt concentrations made up as shown in the dilution table.
Intentions:
I am going to carry the experiment to see how changing the concentration of bile salts affects the rate of reaction. I will only vary the concentration of the bile salts as it is my independent variable. I will keep everything else the same to ensure a fair test. The bile salt concentrations I will be using are 5%, 4%, 3%, 2%, 1% and the control which will be 0% bile salts and 100% distilled water. I will repeat each experiment 3 times in order to show the precision of my values and also the repeatability of the experiment.
The equipment chosen above was chosen specifically to ensure that the results obtained from the final method are both precise and accurate. The accuracy of the reading is dependent on the apparatus chosen and for that reason I will be using a calibrated pipette as opposed to a measuring cylinder due to the greater accuracy of the pipette and this will in turn ensure that my results will be accurate as the same amount of reactants will always be present in the experiment trials.
On the other hand the precision of the data is the ability to measure volumes precisely and therefore gain results which are almost the same to within the accuracy of the equipment. The precision is due completely to the skill of the experimenter in being able to repeat all the same steps and is a measure of the consistency of the results.
The need for accurate and precise data is in order to draw valid and consistent conclusions form the results. While data may be precise in that is it consistent it is not necessarily the correct value due to errors which alter it. Additionally, data may be accurate but over a wide range of value and therefore statistical methods are needed to determine the true experimental value such as the mean and so this is also not valid as well. Overall, the precision and the accuracy of the results determine the reliability as only then can valid conclusions be drawn from the data.
References:
-
- Microsoft ® Encarta ® Reference Library 2005. © 1993-2004 Microsoft Corporation. All rights reserved.
- OCR Biology 1 textbook
- OCR Biology 2 textbook
- OCR Mammalian Physiology and Behaviour
-
-
-
-
-
- OCR PowerPoint on Accuracy and Precision
-
While writing my plan I have taken information from a range of sources and I am now going to evaluate the reliability of the information. All my information from my sources was secondary information. I mainly used biology books and the internet.
The most reliable sources of information are sources 2, 3, 4 and 14. The reason for this is that these are written and or endorsed by OCR and so the information found in here is extremely reliable. Also source 2 is very reliable as it is the Microsoft Encarta which is read and checked by experts and so the information in it is very reliable.
The sources I believe were relatively reliable are sources 6, 7, 9, 10, 11, 12 and 15. These sources are posted on the internet by different servers and people. The reason I think this information is relatively accurate is almost all is posted by reputable companies and all is in accordance with the OCR endorsed sources. However, information from the internet should be placed under some scrutiny as again the reader cannot for certain know who posted the information so some may actually be wrongly informing.
The most unreliable source is probably source 8 and 13 due to it being part of Wikipedia. The reason for this is that Wikipedia is a free encyclopaedia which is maintained by the general public and anyone who has knowledge about a certain subject can edit the entries. This leaves a great gap for anyone who wants to tamper with the entry. However, I believe the information I extrapolated is quite accurate due to the large number of sources I researched and the amount of parallels between them which further confirmed the accuracy of the information present.
My only primary source of investigation was my preliminary trials which helped to inform my plan and devise a suitable method which would help me gain the most accurate and precise data possible.
Skill I – Implementing
For the implementing I was given a new method by my teacher which I followed.
The experiment was carried out under the new method.
Here is the table of results and the graphs that I have extrapolated from them. I believe there are two anomalous results both in the 4% concentration of bile salts reaction.
Experiment 1(My results):
Table to show the results of an experiment in which the bile salt concentration was changed and Lipase was added.
A graph to show the change in pH after 1 minute at different bile salt concentrations
A graph to show the rate of reaction at different bile salt concentrations
Skill A – Analysis
After I placed the class results in a table, I took the average (mean) of the change in pH. I then divided the average by sixty to give the rate per second. I drew a graph using the rate and the bile salt concentration. Using the average change in pH, I divided it by sixty to give the rate per second in seconds-1. I drew a graph using the bile salt concentration and the rate of reaction. I joined the points on my graph with straight lines as I wanted to see if there was an underlying trend. I believe there is one anomalous point at 4% concentration of bile salts where the value for the rate of reaction is too low. I also calculated the standard deviation of the data points in each concentration to see the spread of the data. To work out the standard deviation I used the formula:
I also decided to look at the median of the data as an average and the inter quartile range as these two are not affected by outliers. I divided the median by sixty to give the rate. I also drew a graph with the values. I joined the points on my graph with straight lines as I wanted to see if there was an underlying trend. I believe there is one anomalous point at 4% concentration of bile salts were the value for the rate of reaction is too low compared to the other rates of reactions at 3% and 5%.
A table to show the different statistical techniques I used
To work out the above data firstly I put the values in order from the smallest to largest. Then, I used the following formulae (always round up for the positions):
Lower Quartile = (n/4) gives the position of the value
Median = (n+1/2) gives the position of the value
Upper Quartile = (n/4)*3) gives the position of the value
Inter-Quartile Range = Upper Quartile – Lower Quartile
Range = Highest value – Lowest Value
Outliers = 1.5 (Inter-Quartile Range) to give the boundaries of the data
I also calculated the quartiles and inter quartile range and drew box plots for each concentration to see the spread of the data. I also used this type of statistical test, as it also allowed me to look at the middle 75% of the data and ignore any data points which are anomalous and which would affect the average.
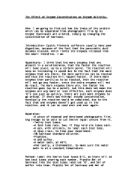
The raw data collected was a graph depicting the change in pH over a period of five minutes at differing bile salt concentrations. The graph started at an alkaline pH due to the carbonate ions. When the bile salts and lipase were added the pH dropped and became gradually neutral and then slightly acidic as the lipase was acting to hydrolyse the triglycerides into fatty acid tails (which are acidic) and glycerol molecules. This section of the graph was an exponential decay graph shape. The graph then flattened out into a horizontal straight line. This is due to all the substrate being already hydrolysed and so there is no substrate left to react. Therefore there is no change in the pH from the production of fatty acid tails.
Another reason for the flattened out horizontal line is that the enzyme has been denatured and so hydrolysis of the lipids can no longer take place. The enzymes tertiary and quaternary structures are held together by interaction between the R-groups of each of the individual amino acids that make up the enzyme. Hydrogen bonds, ionic bonds and disulphide bridges form between these R-groups. Hydrophobic reactions may also play a part. All these work together to give each enzyme a precise shape and form the specific active site, however, at a pH which varies from the optimum pH these different interaction between the R-groups break. The ionic bonds break as the charges are changed due to an increase in either H+ or OH- ions. The breaking of the bonds between the R-groups causes a change in the 3D shape of the enzyme. This changes the shape of the active site, making the substrate unable to either bind to the active site and therefore it cannot be turned into its product. The enzyme is denatured, often permanently. This causes a drop in the rate of reaction.
The results of my experiment were very interesting and significant. As I predicted, the rate of reaction increased with increasing bile salt concentration. There was only one anomalous result in the averages at 4% bile salt concentration. The graph shows an increase in the rate of reaction of lipase with increased bile salt concentration. This is because bile salts acts as an emulsifying agent with increase the surface area of lipids by breaking them up into small droplets called micelles. This allows the enzymes to have a larger surface area to attack and so the rate of reaction is increased.
Also looking at the rate per minute data values, in the 0% bile salt concentration results there are two negative rates of reaction (-1.1 and -0.2) . This indicates a flaw in the procedure. The negative rate of reaction value can be given by the fluctuations in the pH and therefore the pH after 1 minute had actually increased (e.g more alkaline) instead of decreasing to become acidic as shown in the other values. This can be explained by the fact this was a control reaction and so there were no bile salts present, only distilled water was used. In these anomalous reactions, the lipase could only hydrolyse a limited amount of lipids into there products due to the small surface area aggregates of the lipid. The stirring caused the lipase and the lipids to mix but limited hydrolysis took place and so there was a fluctuation in the pH and after one minute the mixture was more alkaline and so the rate of reaction was negative.
In the body this sort of fluctuation in pH does not occur due to the presence of the bile salts. The bile along with the pancreatic juice plays an important role in neutralising the acidic chyme. The bile salts lower the surface tension of the fat globules and thus act to break the lipids into smaller micelles which allow hydrolysis to occur quickly so this fluctuation in pH doesn’t occur. This is so that the pH in the small intestine remains fairly constant at the optimum pH so that the activity of lipase is not affected by the hydrolysis products. As most of the hydrolysis which occurs in the small intestine is near to the villi the acidic products of the hydrolysis are quickly absorbed to minimise any disruption in the pH.
Looking at the graph, I deduced that the rate of reaction seems to be increasing at a decreasing rate. Additionally, the change in the rate of reaction decreases between the increasing bile salt concentrations. The largest change in the rate of reaction is between 0% and 1% (a change of 0.45/s*10-2). To explain this scientifically, the 0% is the control so there is no emulsification of the lipids. When 1% bile salts is added there is an increase in the amount of emulsification and so the rate of reaction increases so much from the control. Afterwards the change in rate of reaction is decreased as there is already some emulsification of lipids and so increasing it further only has a small effect on the increase in total surface area to volume ratio. This occurs through the curve until 4% which is anomalous. The change between 3% and 4% is a negative value (-0.10/s*10-2) as there is an overall decrease in the rate of reaction. If this point is ignored the gradient of the rate of reaction is decreasing throughout as shown in the table of the change in rate between concentrations.
The above data supports my prediction that as the bile salt concentration increases the rate of reaction of the lipase also increases (The rate of reaction increases from 0.64 to 1.69/s*10-2). However, to test the second part of the prediction a higher concentration of bile salts is needed to see if the rate of reaction levels off due to a limiting factor such as substrate or enzyme concentration.
Skill E – Evaluation
I believe the experiments I conducted were quite precise. This is due to many factors affecting the experiment and also the flaws and errors in the procedure. There was one evident anomalous result in the averages in the rate of reaction at 4% bile salt concentration. Also, looking at the change of pH per minute data there were two negative rates of reaction which were also anomalous. The main reasons for this anomaly are the different start pH of each trial in the experiment and the problem of the fluctuating pH readings due to the pH meter. Additionally the problems involved in using pooled data added to this error as each individual experimenter may have implemented the method in various different ways.
All of the improvements below are suggested in order to minimise procedural error and thus improve reliability of the results, and so improve the validity of the conclusion drawn from them.
Procedural limitations
Reliability of results
The reliability of the experiment was improved due to the use of a data logger to accurately record the change in pH instead of using an indicator. This allowed the results recorded to be more accurate than if an acid-alkali indicator had been used instead. Firstly, the data logger placed a numerical value on the change in pH and not just a qualitative response such as a change in colour. Secondly, and more importantly, it reduces the human error involved in recording the results to a very small error which is involved to start the program. However, this can be overcome by placing a trigger which automatically starts recording when there is a small change in the pH. This makes the results obtained more accurate and thus more reliable.
Other things that could affect the reliability of the data were that the class results were pooled and I had to use everyone else’s result. Each group would have implemented the method differently and so this human error has to be taken into account when evaluating and drawing conclusions for the data. All of the errors mentioned above would have been different for each individual person. For example, looking at the meniscus to ensure that the volume measured is the same will look different to different people.
However, using pooled data is also good as it allows comparison between other people’s data to ensure the accuracy of the values obtained. Additionally, more results which are very similar or identical show the degree of precision of the data and thus increase the reliability of the data and so the conclusion deduced are more likely to be valid.
Spread of the Data (standard deviation and inter quartile range) to determine precision of results
Looking at the spread of the data is a good way to evaluate the precision of the data. Looking at my box plots for the change in pH per minute, the box plot for 0% has three outlier values, however the inter quartile range is very small at only 0.2. This means that all the actual data is not very precise because of the outliers. However, ignoring the outlier points makes the value a lot more precise and accurate as the spread is reduced. However, comparing this to the value of standard deviation for the same concentration, the standard deviation is 1.5 times the mean. This gives the impression the data is not very precise as the spread of the data allowed by the standard deviation is so large.
The box plot for 1% has a larger spread of data than 0%, however there are no outliers, so comparing the inter quartile range to the standard deviation; the value is very similar (0.23). This means that the data values for this are more precise. The box plot for 2% has a similar spread to 1% and so the values have a similar precision. Also the standard deviation and the inter quartile ranges’ values are similar.
The box plot for 3% has a much larger spread of the data and has a negative skew. This means the data is less precise than the previous two box plots; however the median was still not anomalous due to its position. Additionally, due to the lack of outliers the value of the inter quartile range was much larger than the standard deviation.
The box plot for 4% had an inter quartile range that was 0.4, however as the data had a negative skew. This made the median lie in the wrong place and so the value was anomalous. The box plot for 5% has 0.6 inter quartile range and a positive skew. The large spread shows that the data is not very precise. However, the standard deviation is quite small in comparison as it takes into account all data values.
The above comparisons of the standard deviation and the inter quartile range imply that the results are actually not precise or accurate due to the large spread in the data. Therefore, the results are not reliable and so only a limited valid conclusion can be drawn for the rate of reaction of lipase. The fact that the results seem to fit the scientific explanation and prediction graphs mean the some valid conclusion scan be drawn, such as that an increase in lipase activity is proportional to the bile salt concentration. However, to draw any more detailed conclusion, such as values for the rate of reaction, is not valid due to the lack of precise, reliable and accurate data that is as a result of the limitations of the method implemented.
Mr Hart & Ms Dennis Biology Coursework