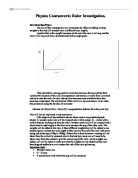
I predict that the more weight put on the greater the depression of the ruler. Also, the more rulers over hang, even more depression of the ruler will occur. This is because there is more weight on the end of the ruler and therefore a greater gravitational force pulling down on the ruler. In scientific terms, I predict that the weight in Newtons will be proportional to the bend in the ruler. I predict this because although this investigation is bending a ruler not stretching it like Hookes law, it will have a similarity to Hooke's first law. Also, like Hooke's first law where there is an elastic limit I predict there will be a bend limit where the ruler will not bend anymore when increased mass is put on.
I will make this a fair test by keeping the vertical and horizontal ruler in exactly the same place throughout the experiment. When I need to adjust the overhang, I will then move the horizontal ruler off the desk more, but I will keep the vertical ruler in exactly the same position. During the course of the experiment I will be altering the mass at the end of the ruler to produce results, but to keep it a fair test I will be putting on the weights in the same position every time.
I am going to take the measurement of how much the ruler bends by using masses increased by 10 Newtons every time from 0 to 60 Newtons, then I will work back down to 0 Newtons taking 10 Newtons off every time. The point of this is to work out an average; I will do this by adding the two results up and dividing by two so I get a more accurate final value. Proper scientists use the same process but do it hundreds of times, If I could do this I would but I do not have enough time, therefore I shall only repeat the experiment once per overhang length. I will not use more than 6 Newtons because this could snap the ruler if any more mass was added which could be dangerous.
I think 6 are a suitable amount of values for each test because I then have enough to produce fairly accurate graphs. I will record results for an over hang of 30cm, 50cm and 80cm.
All my measurements will be taken to one decimal place instead of to the nearest whole number, this is because I can produce more accurate graphs, and hopefully it is easier to see the similarity between the three tests.
Obtaining Evidence
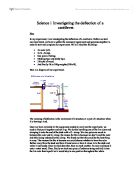
I remembered my safety procedures. No one in the class got hurt and no equipment was damaged. I thought the best way to record my results was in a table as it is easy to fill in results, easy to study and it is tidy. I have included all results and some of which are different to the first results so the average taken was between two results. I think it was important to record the results more than once so I get a more accurate result, like proper scientists do. Unfortunately, I could not repeat the experiment hundreds of times like proper scientists because I didn't have the time, so I only repeated the experiment once, which is better than not repeating it at all. To measure accurately I used the pin on the end of the ruler and also used a setsquare to make sure I was reading off on a straight line. I also remembered to crouch down to take the results to avoid parallax.
Below are my results for my investigation:
30 CM OVERHANG:
Mass (N) Measurement 1(cm) Measurement 2 (cm) Avg Overhang (cm, 1dp) Bend (cm)
0 13.3 13.3 13.3 0.0
1 13.5 13.4 13.45 +/- 0.05 0.15 +/- 0.05
2 13.6 13.5 13.55 +/- 0.05 0.25 +/- 0.05
3 13.7 13.6 13.65 +/- 0.05 0.35 +/- 0.05
4 13.8 13.8 13.8 0.4
5 13.9 13.9 13.9 0.5
6 14.0 14.0 14.0 0.6
50CM OVERHANG:
Mass (N) Measurement 1(cm) Measurement 2 (cm) Avg Overhang (cm, 1dp) Bend (cm)
0 13.8 13.8 13.8 0.0
1 14.1 14.1 14.1 0.3
2 14.4 14.4 14.4 0.6
3 14.7 14.6 14.65 +/- 0.05 0.85 +/- 0.05
4 15.1 15.2 15.15 +/- 0.05 1.35 +/- 0.05
5 15.5 15.5 15.5 1.7
6 15.9 15.9 15.9 2.1
80CM OVERHANG:
Mass (N) Measurement 1(cm) Measurement 2 (cm) Avg Overhang (cm, 1dp) Bend (cm)
0 14.0 14.0 14.0 0.0
1 15.0 15.0 15.0 1.0
2 15.9 15.9 15.9 1.9
3 16.9 16.8 16.85 +/- 0.05 2.85 +/- 0.05
4 17.8 17.8 17.8 3.8
5 18.7 18.7 18.7 4.7
6 19.7 19.7 19.7 5.7
You can see from these results I have calculated the average depression by finding the average of measurement one and two. As you can see, unfortunately some of the results are between values of 1 MM; this is inconvenient for me because I did not use a scale accurate enough to record these results as I did not have accurate enough measuring instruments. Therefore, on my graph I will plot my results with error bars 1MM long. On the following pages is my section of evaluating my results. This section is mainly graphs showing, hopefully, result patterns.
Analysing Evidence/Drawing Conclusions
To see whether there is a pattern I am going to produce another table, which is below to compare results. Also, on the next page is a graph comparing results to see what shape the lines form. If it is proportional, which I predicted it will be a straight line through the origin.
Bend-30cm Overhang Bend-50cm Overhang Bend-80cm overhang
Mass (N) Depression (Cm) Depression (Cm) Depression (Cm)
0 0.0 0.0 0.0
1 0.15 +/- 0.05 0.3 1.0
2 0.25 +/- 0.05 0.6 1.9
3 0.35 +/- 0.05 0.85 +/- 0.05 2.85 +/- 0.05
4 0.4 1.35 +/- 0.05 3.8
5 0.5 1.7 4.7
6 0.6 2.1 5.7
From these results I have found that the larger masses added to larger ruler overhangs causes a larger depression and the mass added is proportional to the depression created. I know this by having straight lines of best fit through the origin. Also, I have found patterns in the comparison table for each over hang. I found this pattern by dividing the Depression by the mass added for each result for one overhang. After this I then took the average (2dp) of these six values and then found if I multiply this average value with the mass added I get a very close result compared with my actual results. For example take the average of the values of the 80 Cm overhang that was 0.32, multiply this by the six Newton mass and you get a depression of 5.76cm. This is only 0.06 of a CM off my results that could be blamed for the ruler I used which was not accurate enough down to one tenth of a millimetre. I also found that if you triple the 30CM you roughly get the value for the equation for the 50CM overhang and if you triple that you get the value for the 80CM overhang equation. The equation formulas are shown in the diagram below. (These equations are not exactly accurate but are very close. If I had a more accurate ruler maybe I could of found the exact equation.)
Depression of 30CM Overhang - 0.12 Mass Added
Depression of 50CM Overhang - 0.32 Mass Added
Depression of 80CM Overhang - 0.96 Mass Added
Apart from finding the pattern, I thought I would get the other results. I predicted this because I thought it would be similar to Hooke's first law, which is force applied is proportional to the stretch created. Hooke's first law, although it has a straight line through the origin (Proportional), it eventually reaches its elastic limit, the graph then starts to bend. However, my results do not show that there is a bend limit. That is probably because I did not put enough mass on the end of the ruler to find this out. Because of this my graph does not bend. Maybe there is no bend limit or maybe I did not apply enough force on the end of the ruler to record it.
Hooke's first law applies to stretching an object and my investigation was bending an object, but I still thought there was a comparison between the two of them because both involve the increase/decrease of mass and both involve the recording of how much it bends/stretches.
Evaluation
I thought the investigation went well. My prediction turned out to be correct, all three graphs are proportional therefore it is safe to say that the mass added to a ruler is proportional to the amount it bends. This prediction was correct but it seems that I did not find out if it had a bend limit because I did not put enough mass on the end of the ruler, and my graph did not start to bend at the top.
I did have a couple of anomalous results on in my results, but they were not totally wrong, they just were not as accurate as I would have liked them to be. This caused me not to have a dead straight line, but when I tried to fit a line of best fit in, it formed a straight line through the origin. This tells us that the investigation could have been done more accurately in which to find more accurate results.
On my graphs I had to plot the points with error bars because the scale of the ruler was not accurate enough. I also did not predict that I would find a pattern when comparing the results, but this turned out to be the case.
If I had to repeat the experiment I would use a more accurate ruler that had a scale down to one tenth of a millimetre, rather than a one-metre rule with a scale down to millimetres.
This would then enable me to plot the values at proper points rather than error bars; maybe, this could of given me a straight line. I would also use a larger range of masses to see whether there is a bend limit, as I predicted. This would then prove that the depression of a ruler is a lot like the stretching of a spring. If I had more time I could of got more information to get a definite pattern by using every overhang to the nearest ten centimetres from ten cm up to ninety cm of the ruler. These results could have then reassured me of my conclusion that the mass added is proportional to the depression of the ruler and would of made my evidence more reliable.
I believe that it really was a fair test. I used the most accurate method possible to measure the depression with the resources available and only altered the overhang of the ruler when I needed to.
To get more information about this topic you could study textbooks, encyclopaedias and surf the Internet. This information would make me sure of my conclusions by having conclusions of proper scientists. It would be different compared with my results by probably being more in depth and they would have used different procedures in which to find the results.