Graph To Show The Effects Of Temperature On Enzyme Action
Concentration:
The concentration of Hydrogen Peroxide is shown by the volume of oxygen that can be obtained from it, and is measured in vol’s. This is not to be confused with the normal measurement of volume, and you can have 10cm2 of 5 vol. Hydrogen Peroxide.
1 cm3 1 vol. H2O2 1 cm3 O2
10 cm3 1 vol. H2O2 10 cm3 O2
10 cm3 10 vol. H2O2 100 cm3 O2
The rate of reaction will increase as the substrate concentration increases until the threshold rate of reaction is reached. This is when there are no more active sites available for the substrate to be broken down in.
Graph To Show The Effect Of Substrate Concentration On Rate Of Reaction
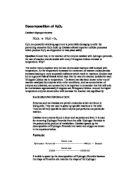
Catalysts:
Catalysts work by providing an alternate pathway for the reaction. This pathway will have a lower activation energy, than the original pathway. Activation energy is the amount of energy needed for the reaction to take place. More collisions will have enough energy to take this new pathway.
If there were no catalase enzymes present then the rate of reaction would be much slower, as there would be no catalyst to make the activation energy required for the reaction, lower. Presuming that all of the particles are hitting each other at the same speed as they would with the catalyst present, then less of the collisions would result in a reaction, because the force of the collision would not be great enough. (See collision theory above)
Diagram To Show the Effect Of A Catalyst On The Activation Energy Required For A Reaction To Take Place
Surface Area:
If a small piece of liver is used, then the rate of reaction will be slower. If a large piece of liver is used then the rate of reaction will be faster. This is because reactions work best when the reactants have a big Surface Area. The greater surface area enables more particles to collide and speed up the reaction.
Graph To Show The Effect Of Surface Area On Rate Of Reaction
p.H
All enzymes are made in cells. Most remain inside the cell and are called intra-cellular enzymes. They have an optimum p.H of 7 (neutral).
Enzymes that are made in cells and released to work outside the cell are called extra-cellular enzymes, eg salivary amylase. these have a different optimum p.H depending on their task.
Graph To Show The Effect Of p.H On Rate Of Reaction
Preliminary
Work
Equipment List:
● 300cm3 Hydrogen Peroxide
● 4 conical flasks (to be washed, and re-used during experiment)
● 4 water baths (to be re-used during experiment)
● 2 Cork bungs with pipe attachments (to be re-used during experiment)
● 2 Gas syringes (to be re-used during experiment)
● 2 Thermometers
● 2 Stop clocks
● 4 20cm2 measuring cylinders (to be washed, and re-used during experiment)
● Tweezers
● Scissors
● Scalpel
● Cutting tile
● Top Pan Balance
●
●
Diagram:
Procedure:
16 cm3 of 10 vol. Hydrogen peroxide will be measured into each of the 16 conical flasks. These will then be placed in a water bath to bring 2 of each to each temperature, (10°C, 20°C, 30°C, 40°C, 50°C, 60°C, 70°C, & 80°C). Once the desired temperature has been reached, an equilibration time of 5 minutes will be given.
The piece of liver will be cut into 16 small pieces, approximately the size of a grain of rice. Each will be weighed, to make sure that they are close enough in weight for it not to affect the results drastically.
Then the pieces of liver will be added to the Hydrogen Peroxide. The stop clock will be started, and the volume of gas collected will be noted every 30 seconds for 5 minutes.
How I Will Make It A Fair Test:
I will use the same weight and approximate surface area of liver pieces, so that this does not affect my results.
I shall try to get the temperatures as accurate as possible, although this may be difficult due to lab equipment constraints.
I am using the same concentration and volume of Hydrogen Peroxide each time, and taking the liver pieces from one sample of liver that will be cut into smaller samples.
Safety:
●It is unsafe to heat Hydrogen Peroxide directly, as it is flammable, so a water bath will be used, and no Bunsen burners will be lit in the lab.
●Hydrogen Peroxide is a bleach and is also toxic to humans, so if it is spilt on anyone or anything it must be washed off immediately, to prevent damage.
●Goggles must be worn at all times, as if Hydrogen Peroxide was to splash into your eye you could be blinded forever.
●The scalpels and scissors to be used for cutting the liver into pieces are very sharp and could potentially cut someone. These will be used with care, and stored in a safe container.
Range & Number Of Observations:
I shall perform the experiment 2 times at each temperature between 10°C and 70°C inclusive, at intervals of 10°C. This ensures that the results are accurate and reliable.
OBTAINING EVIDENCE
I used my equipment following my safety guidelines outlined in my plan. I recorded results at intervals of 10°C, from 10°C to 70°C inclusive. I did this so that I would have enough results to analyse and form a conclusion. I recorded my information in the tables in the next few pages. I used my equipment accurately, measuring to the nearest 0.5mm3. I used accurate amounts of Hydrogen Peroxide, measuring them to the nearest mm3. I used a wide range of temperatures, so that I had a wide range of results from which to draw more reliable conclusions. I had planned to repeat all of my readings at least once, but did not have time in the lesson to do this, which made time one of the constraints in this experiment. I only managed to do repeat measurements at 10°C, 20°C and 70°C. I did them at these temperatures, as I wanted to check that there was no increase after 30 seconds at 70°C, and because the readings at 10°C and 20°C are quite small and I wanted to make sure they were more reliable and accurate.
I used a gas syringe to collect the oxygen bubbling off the Hydrogen Peroxide, as accurately as possible, as I wanted to obtain more precise results than you would by measuring the froth or by counting the bubbles coming through a water bath through a syringe from the conical flask.
ANALYSING EVIDENCE AND DRAWING CONCLUSIONS
From doing this investigation I have found out that as the temperature of the Hydrogen Peroxide changes, so does the rate at which the reaction takes place. This is because the Catalase enzyme in the liver is suited best to a particular temperature, at which it catalyses the Hydrogen Peroxide faster. My results show that the
From the tables and graphs, I am able to back up my hypothesis. I can see at which temperature the enzyme is most active and when it becomes denatured. The enzyme Catalase is at its optimum temperature at 40 °C, this is where the greatest number of collisions takes place between the enzyme and the substrate molecule and therefore is when the highest rate of reaction occurs.
The rate of reaction was faster at 40ºC because as the temperature is raised, so is the energy level of both the enzymes and the substrate molecules. This means that they have more energy to move faster and collide with each other more often and with a greater force, and therefore more reactions will occur.
This means that more oxygen (O2) is produced, towards the optimum temperature, which is collected in the gas syringe. The enzyme is denatured at about 70ºC, because the shape of the active site has been so distorted by the temperature, that it can no longer accept any substrate molecules. The active site is permanently changed, and the enzyme is said to be denatured because it can no longer form an enzyme-substrate molecule as its active site.
My prediction that the enzyme activity will approximately double for every 10°C increase in temperature, until the optimum temperature is reached was shown in my results between 0°C and 20°C, but the increase was far more between 20°C and 30°C than I had anticipated.
My prediction was correct in that there was very little activity in the ice bath because the speed at which the enzymes and substrate molecules were moving was very slow, and so there were not many collisions between them, and they weren’t colliding with much force. The optimum temperature was the same as I predicted at 40º (the closest temperature to 37°C). The temperature at which the enzyme denatured and the activity stopped, was 70°C, but the enzyme started to become denatured from 60°C.
I did not have any obvious anomalies, but there were some points on the graphs (at 30°C and 50°C) which were slightly off the line of best fit, and I think this was probably because I did the experiments for these temperatures on a different day to the others, and the gas syringe probably had a bit of friction, and would consequently ‘jump’ every so often. It was not a huge amount, and so did not greatly affect my results.
EVALUATING EVIDENCE
Although I did the experiment as accurately as I possibly could there were many sources of error in the method that I used. At the beginning, i needed to put the liver into the conical flask, hold the conical flask in the water bath, put the bung in the conical flask and start the stopclock all at the same time. I was not able to do these all by myself, and so I asked a friend to put the live in and the bung on whilst I started the stopclock and held the conical flask in the water bath. There was often a slight delay in starting the stopclock and putting the bung in the conical flask. These factors will make my results less reliable. I did use the same piece of liver during my experiment though, and this will make my results more reliable as the concentration of Catalase in the liver would be the same for all the experiments.
I used the same gas syringe for most of the experiments, but for the last two, at 30°C and 50°C, I used a different syringe, as it was the only one available, and it was not lubricated enough, and ‘stuck’ a little. This will have made those results less reliable. Another problem was that I had to leave the Hydrogen Peroxide solution to acclimatise to the temperature for longer than I had originally expected, which took up more time, and did not allow me to repeat many of the experiments twice.
The sizes of the pieces of liver was a problem too, as it was not possible to make them all the same size, and weighing them didn’t work, as they were too small to be registered on the scales. I couldn’t use a larger piece of liver, as the amount of oxygen collected in the gas syringe would have been too great. If I were to do this experiment again then I would probably want to do it on a larger scale, so that I could weigh the pieces, and make the sizes more accurate.
If I were to repeat the experiment then I would take more readings more often, probably every 15 seconds at 5ºC intervals. If I did this I would be able to plot a more accurate graph and it would be easier and more accurate to tell when the Catalase got to its optimum and denaturing temperatures.
The evidence that I obtained is sufficient enough to support the conclusions I have come to about the values for the optimum and denaturing temperatures, despite the errors in the method, because I conducted my experiment as accurately as I could with the method I used and I did quite a large range and number of repetitions to make the results more reliable. At the temperatures where I did repetitions, the lines of the graphs were close fitting enough to suggest that the variation was small, and that my results were accurate and reliable, as there was little difference between them, and they followed the same curve. This means that the other temperatures, where I didn’t have enough time to do repeats are more likely to be reliable and accurate.
To improve my experiment I would also do experiments at 0°C, 80°C and 90°C, to support my conclusion regarding the denaturing and inactivation of the catalase enzymes.
FURTHER EXPERIMENTS I COULD DO
I know that Catalase is also present in celery, and if I were to extend this investigation then I would do the same experiment, but on celery, to see if the same theory works on Celery.
Aim:
To find out if temperature affects the decomposition of Hydrogen Peroxide, when using celery as a source of Catalase.
Prediction:
Method:
Hydrogen Peroxide Water + Oxygen
2H2O2 (aq) 2H2O (l) + O2 (g)
When the temperature is increased the Hydrogen Peroxide particles will move faster. As they are moving faster they will collide with each other more often. The particles will be colliding with more force as they are moving faster, and so are more likely to react (see collision theory below).
Enzymes work best at 37°C. Above 60°C the enzymes begin to become denatured. The heat changes the shape of the enzyme causing the active site to become distorted, slowing down the rate of reaction, as it cannot break down the substrate molecules as quickly. The active site will eventually become so distorted that it will no longer accept any substrate molecules, and the reaction stops. Denaturing is not reversible.
As the temperature decreases, enzyme activity decreases. This also causes a slowing in the rate of reaction. This idea is used in refrigeration, where food is kept below 4°C to keep enzyme activity at a minimum. Below -20°C enzymes don’t function at all. However, freezing the enzymes does not destroy them, and as they thaw, they will become active again. For every increase of 10°C, you should see a doubling of enzyme action, until the optimum temperature is reached.
Collision Theory:
The collision theory states that particles must collide hard enough to react and that the rate of a reaction depends on how often and how hard the reacting particles collide with each other. Not all collisions will result in a reaction.
Method:
160 cm3 of 10 vol. Hydrogen peroxide will be measured into each of the 38 conical flasks. These will then be placed in a water bath to bring 2 of each to each temperature, (0*C, 5°C, 10°C, 15°C, 20°C, 25°C, 30°C, 35°C, 40°C, 45°C, 50°C, 55°C, 60°C, 65°C, 70°C, 75°C, 80°C, 85°C, and 90°C). Once the desired temperature has been reached, an equilibration time of 10 minutes will be given.
The celery will be cut into 38 medium sized pieces, approximately 2cm by 2cm. Each will be weighed, to make sure that they are close enough in weight for it not to affect the results drastically.
Then the pieces of celery will be added to the Hydrogen Peroxide and the stop clock will be started. The volume of gas is to be collected will be noted every 15 seconds for 5 minutes.
Diagram: