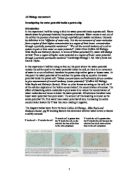
The diagram below taken from the book Collins AS Biology- Mike Boyle and Katharyn Senior, pg 78 showing factors that determine whether water enters or leaves a cell by osmosis
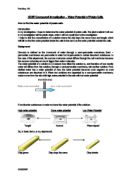
Samples of potato chip will be are allowed to come to equilibrium in a range of solutions of different sucrose concentrations. The concentration where the potato chip neither gains nor looses mass will have the same water potential as the potato tissue.
Risk Assessment
To make the experiment
- safe the equipment that was sharp i.e. Scalpels and core borers are used carefully on a cutting tile i.e the scalpel is uswed to cut away from the person
- Also in case of anything getting into the eyes goggles were worn at all times.
- Not getting any of the solutions in my eyes or mouth.
- Making sure all the equipment is safe on the desk and not able to be broken or knocked off the edge and damaged.
Results:
Below is my initial table of results showing average mass change of the potato chip at
different sucrose concentrations. Graph 1 shows the average mass change of the potato chip at the different sucrose concentrations.
Initial Table of results: Average mass increase at different sucrose concentrations
Graph 1 shows average mass change at the different sucrose concentrations. As you can see there is a general negative trend. As the sucrose concentration increases the mass the potato chip gains became less and less, and by 0.4 M sucrose concentration the potato chip is loosing mass. However as you can see from my graph the average mass change for 0.5 and 0.6 M concentration are anomalous as they clearly do not fit into the general negative trend. I carefully redid the experiment for those two sucrose concentrations, and obtained the following results.
I substituted these new results to plot Graph 2 showing average mass change of the potato chip at different sucrose concentrations. The results I got for the repeated experiment appear to lie near the line of best fit.
I calculated the % mass change for each sucrose concentration:
Look at Graph 3 shows the % Average mass change at different sucrose concentrations. I drew this graph to show % mass change as this is a better indicator of showing the gaining or loosing of mass of the potato chip. I drew a line of best fit to show the general trend. The results I repeated for 0.5 and 0.6 (M) concentrations appear to fit the trend of the graph so I will keep theses results. The line of best fit shows the general negative trend that as the sucrose concentration increases the increase in potato mass became less and less. At 0.00M sucrose concentration (pure water) you can see the chip has gained most mass, this is because there is a much greater sucrose concentration inside the cell compared to its surroundings, lowering the Ψ inside the cell. As the Ψ outside the cell is much greater than Ψ inside the cell there was a net movement of water from the solution of high Ψ to the low Ψ inside the cell. So the potato chip gains mass. As the sucrose concentration continued to increase the potato gains less and less mass, for example at 0.1M of sucrose concentration the chip gains 0.36g whereas at 0.3M the chip only gains 0.19g. Reason being the difference in Ψ between the cell and its surroundings is beginning to decrease. As sucrose concentration in the solution is increased its Ψ is lowered, therefore there is a less net movement from the solution of higher Ψ to the potato chip of lower Ψ. The graph shows as the sucrose concentration continues to increases. there comes a point where the opposite happens and the potato chip begins to loose mass. Water begins to osmose out of the potato chip. This is because at the higher sucrose concentrations, the cells cytoplasm contains fewer sucrose molecules in comparism to the surroung solution. Ψ inside the cell is greater than the Ψ outside the cell because the solution has much more solutes than in the cell cytoplasm. So water moves from higher water potentrial (inside the celll) to lower Ψ ( outside the cell). As Graph 3 shows the line of best fit crosses the X axis at 0.33 M sucrose concentration. This is the concentration where the potato chip neither gains nor looses mass and will have the same water potential as the potato tissue.
Graph 4 shows the relationship between molarity and Ψ potential of sucrose solution. I created this using data taken from the book Biological Sciences 1,2 and 3 D.J Taylor , N.P.O Green GW Stout . Knowing that at 0.33M sucrose concentration the potato chip had the same water potential as the potato tissue I used graph 4 as shown by the red line on graph 4, that the estimate for the Ψ inside the potato cell is -900kPa.
Evaluation
I found the experiment fairly easy to do and believed my method worked as I was able to obtain some fairly accurate results, which as you can see from the graph 1 my results had a visible trend. The two initial anomalous probably occurred because of my negligence. For example at one time in the experiment I forgot which beaker carried what concentration of solution and had to guess because of the shortage of time. This may have led to the anomalous results. However after redoing those sucrose concentrations, I obtained much more accurate results which fitted into the general trend. These results enabled me to analyse them and work out the final Ψ potential of the potato. However there are always there some errors that could have been reduced and some procedures that could have been changed to stop these errors from occurring.
One disadvantage of the method I used was that it was easy to contaminate the sucrose and distilled water because as each test tube is filled up with the different molar solutions the syringe, which would measure the amount of solution, placed in the test tube may become contaminated with different molarities. To stop this beaker and syringe must be washed thoroughly every time they are used.
Also when drying off the potato it was difficult to remove al the excess solution off the potatoes without pressing to hard and removing the fluid from inside the potatoes. This would have resulted in an inaccurate decrease in mass therefore the percentage change in mass would also be inaccurate. This could be changed by using a rolling technique of the tissue paper to remove the excess fluid instead of just pressing on the potato tubes.
I think I took enough results for the amount of molarities that I was given, and the time restrictions that I had to follow, The range was big enough, but to fill in the gaps in my graph, I could have taken results of more molarities, so instead of taking results from 8 different molarity levels I should take 10 molarity levels. This would make the lines of best fit on the graphs more reliable, therefore the end results would be more reliable. Furthermore repeating the whole experiment and taking more averages will increase the accuracy and reliability of the results.
I could extend my enquiry by testing the percentage change in mass with molarity using a different substance. By this I mean using a different vegetable, perhaps celery or cucumber. Then I could find out whether the water potential of different vegetable cells differ
I could also investigate other external factors which effect the process of osmosis in plant cells.