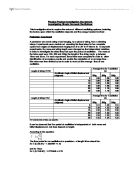
Masses ranging from 100g to 400g at 50g intervals were attached to the spring and both the resonant frequency and amplitude were recorded. The amplitude was measured by subtracting the increase in extension whilst at maximum amplitude, (at resonant frequency) from initial spring extension without any oscillation (using the ruler). Each experiment using a different mass was completed three times as the actual point of resonant frequency was a little subjective. Again, this allowed the identification of anomalous data and the calculation of average values.
Safety: A plastic cylinder surrounded the mass and spring to stop the spring swinging violently and the mass becoming detached. Mains electricity was used safely through a signal generator.
Full table of results in appendix.
Like the preliminary experiment it was observed that the acceleration of the mass was greatest as it began to move back towards equilibrium and the velocity is greatest as it passes this point. Unlike the preliminary experiment, the frequency does depend upon mass. The graph shows negative correlation between mass and resonant frequency - as the mass was increased, the resonant frequency decreased.
This can be seen in the following equation:
T= 2π √(m/k)
Therefore, as k and 2π are constants:
T ∝ √m
(1/f) ∝ √m
As frequency increases the value of 1/f becomes smaller, which as it is proportional to the square root of m, means that m also decreases.
The results obtained experimentally indicate a slightly more linear relationship than expected which is likely to be caused by measurement error.
Calculation of error:
With the mass values and spring constant a value for frequency can be calculated using the equation:
The previous graph shows the discrepancies between observed and expected values, with a difference of around 0.5 Hz. A difference of this nature possibly indicates that the signal generator was producing frequencies approximately 0.5Hz higher than measured.
The graph shows that the amplitude at the resonant frequency increases with mass. This is because there is more energy in the oscillating system with greater mass resulting in larger displacement. The amplitude seems to plateau, possibly because increasing amounts of energy are required to extend the spring when stretching it further– in accordance with the square relationship E=1/2 kx2 .
A source of error in this experiment is due to the sometimes subjective nature to recognising the point when the system was actually at its resonant frequency. However, the frequency generator was not particularly sensitive and the pointer was a little unreliable, so error bars on the first graph are small. The errors are larger for the amplitude measurements - simply because the system had so much energy that the maximum vertical displacement was difficult to measure before it started swinging.
Damped Oscillations
The above experiment was repeated with a constant volume of water in the plastic cylinder, covering the mass, acting as a damping force. As above, both the maximum amplitude and resonant frequency were recorded in three trials and the average calculated, removing any anomalous results.
Safety: Wires were kept away from water at all times.
See appendix for full table of data, including anomalous results.
Exactly the same relationships are true as in the undamped system, the values are just lower. The damping effect of water is due to the removal of energy from the system and is caused by friction between the mass and damping fluid. Kinetic energy is lost as heat to the water.
The error range of amplitude is however larger due to additional difficulty in recognising the point of resonant frequency, caused by the large damping effect. It is presumed that a similar error in measured frequency values, as in the undamped experiment, is also present in this experiment.
The amplitude showed a more linear increase. This is probably because the spring extension between different mass values was that much smaller due to damping. If the energy of the system is proportional to the amplitude2, a system with decreased energy causes amplitude to be reduced considerably (as a consequence of the square relationship).
A source of error could be that the surface area of the hanging mass does not remain constant – meaning there could be additional friction between mass and fluid with larger masses and consequentially a greater loss of energy.
The effect of the damping can be seen more easily by comparison between the two experiments.
As can be seen in the graph, the resonant frequency is consistently lower in the damped system than in the undamped system.
The damping effect reduces the resultant frequency by an average of 0.52Hz. The percentage decrease in resonant frequency increases slightly with mass – possibly due a greater surface area of larger masses as discussed above.
To calculate an approximate percentage change, where the lines of best fit are almost equal in gradient (0.4 and 0.44), the first point was removed. The intercepts differ by 7.92 meaning that, over this range of values, the amplitude is reduced by approximately 8cm by the damping effect of the water. As a percentage change this is: (8/8.81) x 100 = 91%.
The reason that, in reality, the difference is not linear (especially in the undamped) system is the square relationship between amplitude and energy (E=1/2 kx2).
The energy of the system is equal to the sum of the kinetic energy and potential energy at any point. The easiest way of calculating the total energy is when the kinetic energy is zero and all the energy is stored as potential energy in the stretched spring. This allows the use of the previously mentioned equation:
E=1/2 kx2 (x being the amplitude of oscillation)
Calculation of Spring Constant:
The graph shows, as expected, that system energy increases with mass whether it is damped or not, but the increase is much larger in the undamped system. The damped system has lower energy due to the fluid density providing a buoyancy force acting upwards against the weight of the masses – causing a smaller downwards resultant force and meaning a large amount of energy is lost as heat to the water through friction. As mentioned before, an uncontrolled variable in mass surface area could add to this effect, the larger the mass, the greater the surface area for loss of energy through friction.
It was planned to further the investigation with a more viscous damping fluid, but the large effect of water damping (water being a particularly non-viscous liquid) caused the belief that the system would then be damped to a critical point, or possibly over-damped. This would result in near impossible measurements of frequency as the frequencies were already very low with water.
The spring constant, k, could be changed and would affect the energy and therefore the whole oscillation of the system. Increasing k would mean a larger amount of energy could be stored in the spring – increasing displacement and frequency and decreasing the period, in accordance with the equation:
T= 2π √(m/k)
Changing the diameter of the cylinder containing a constant volume of water may also have an effect upon how easy it is for the water to be displaced sideways by the masses – increasing the diameter could potentially make the displacement easier, losing less energy and having less damping effect.
If this experiment was to be repeated I would ensure that the mass was of constant surface area. The effect of damping with different shaped masses, or those with different surface areas could also be investigated further.
Summary/Conclusion
In a system for which frequency is dependent upon mass, increasing the mass decreases the frequency. The amplitude is increased as the weight force acting upon the spring is larger and the system has more energy.
In both an undriven and damped system showing simple harmonic motion, energy is lost as heat through friction between moving parts and the fluid surroundings – whether it be air or water. The damping effect in water is great as it is much denser than air. This means there are more particles in a constant volume which cause frictional resistance against a moving mass, causing the system to lose energy as heat to the fluid. The loss of energy is apparent in the loss of amplitude, or spring extension.
Despite having relatively small error bars on graphs, the reliability of the results is questionable, mainly due to dubious frequency values measured experimentally.
However the majority of the relationships and trends can still be seen. More accurate frequency values would have allowed a more accurate calculation of damping effect on resonant frequency.
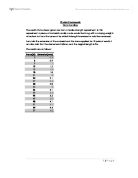
Anomalous results (in red) are not included in averages.